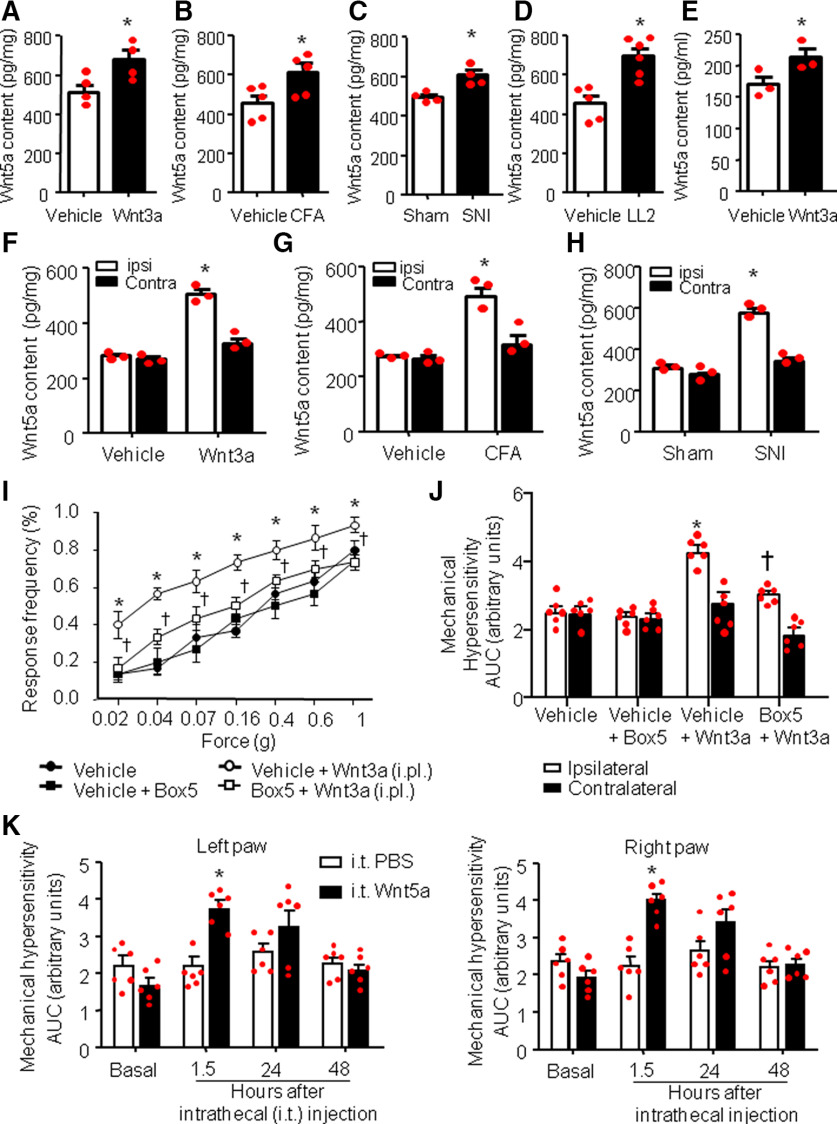
Figure 1.
Wnt5a content is increased in the spinal dorsal horn in response to peripheral Wnt3a signaling, and in models of chronic pain and spinal Wnt5a mediates peripheral Wnt3a-induced nociceptive hypersensitivity. A–D, ELISA-based analysis of Wnt5a content bilaterally in spinal dorsal horns in vivo after intraplantar unilateral injection of recombinant mouse Wnt3a (10 ng/20 µl; A), on inducing unilateral inflammation (intraplantar CFA injection; B), after SNI (C), or in a model of cancer pain (tumor growth induced by LL2 lung carcinoma cells in the calcaneus heel bone of the hindpaw; D). N = 3–4 mice/group. Student's t test was performed. *p < 0.05 compared with vehicle treatment. E, ELISA-based analysis of release of Wnt5a from DRG neurons in culture after treatment with recombinant Wnt3a (10 ng/ml). N = 3 independent cultures/group. Student's t test was performed. *p < 0.05 compared with vehicle treatment. F–H, ELISA-based analysis of Wnt5a content in ipsilateral versus contralateral spinal dorsal horns in vivo levels after intraplantar unilateral injection of recombinant mouse Wnt3a (10 ng/20 µl; F), on unilateral CFA-induced paw inflammation (G), or after unilateral SNI (H). N = 3 mice/group. Student's t test was performed. *p < 0.05 compared with vehicle treatment. I, J, Behavioral analysis of the effects of intrathecal administration of Box5 (2 µg/µl), a specific inhibitor of Wnt5a signaling (applied 30 min before Wnt3a application), on mechanical sensitivity measured 1 h after intraplantar unilateral paw injection of Wnt3a (10 ng/20 µl). Integral of response frequency–von Frey force intensity curves over time for the Wnt3a-injected (ipsilateral) paw and the contralateral paw are shown in J. N = 8 mice/group; ANOVA for repeated measures was performed, followed by Tukey's test; *p < 0.05 compared with the corresponding control group; †p < 0.05 compared with Wnt3a-treated animals. K, Effect of intrathecal injection of recombinant mouse Wnt5a on mechanical sensitivity of mouse hindpaw, shown as integral of response frequency–von Frey force intensity curves over time for both paws. N = 8 mice/group. ANOVA for repeated measures followed by Tukey's test was performed. *p < 0.05 compared with the corresponding control groups. In all panels, data are represented as the mean ± SEM, and bar graphs are also shown as scatter plots. ipsi, Ipsilateral; Contra, contralateral; i.pl., intraplantar;i.t., intrathecal.

