Figure 3.
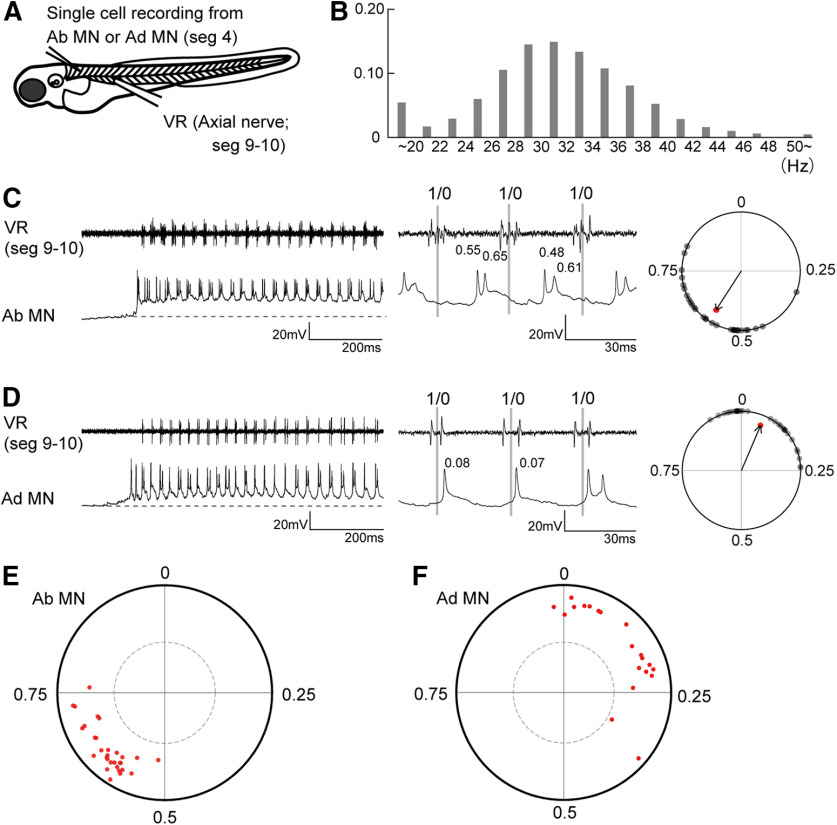
Firing patterns of abductor and adductor MNs during fictive swimming. A, A schematic illustration of the simultaneous recordings of an abductor or adductor MN (loose patch or whole cell) and VR. B, Histogram of fictive swimming frequency (2920 cycles from seven fish). C, An example of the recording (whole cell current clamp) from the abductor MN. The dotted line indicates the resting membrane potential. The middle panel shows a close-up view of three swim cycles. For the phase analysis of spike timings, the middle time point of a VR activity was assigned a phase value of 0, and that of the next VR activity was assigned a phase value of 1. The right panel shows a circular plot of the spikes relative to VR activity during fictive swimming. D, Same as C, but for the adductor MN. E, Circular plot showing spike timing of abductor MNs (n = 30). Dotted circle line marks the 5% significance level. F, Circular plot showing spike timing of adductor MNs (n = 20).

