Figure 4.

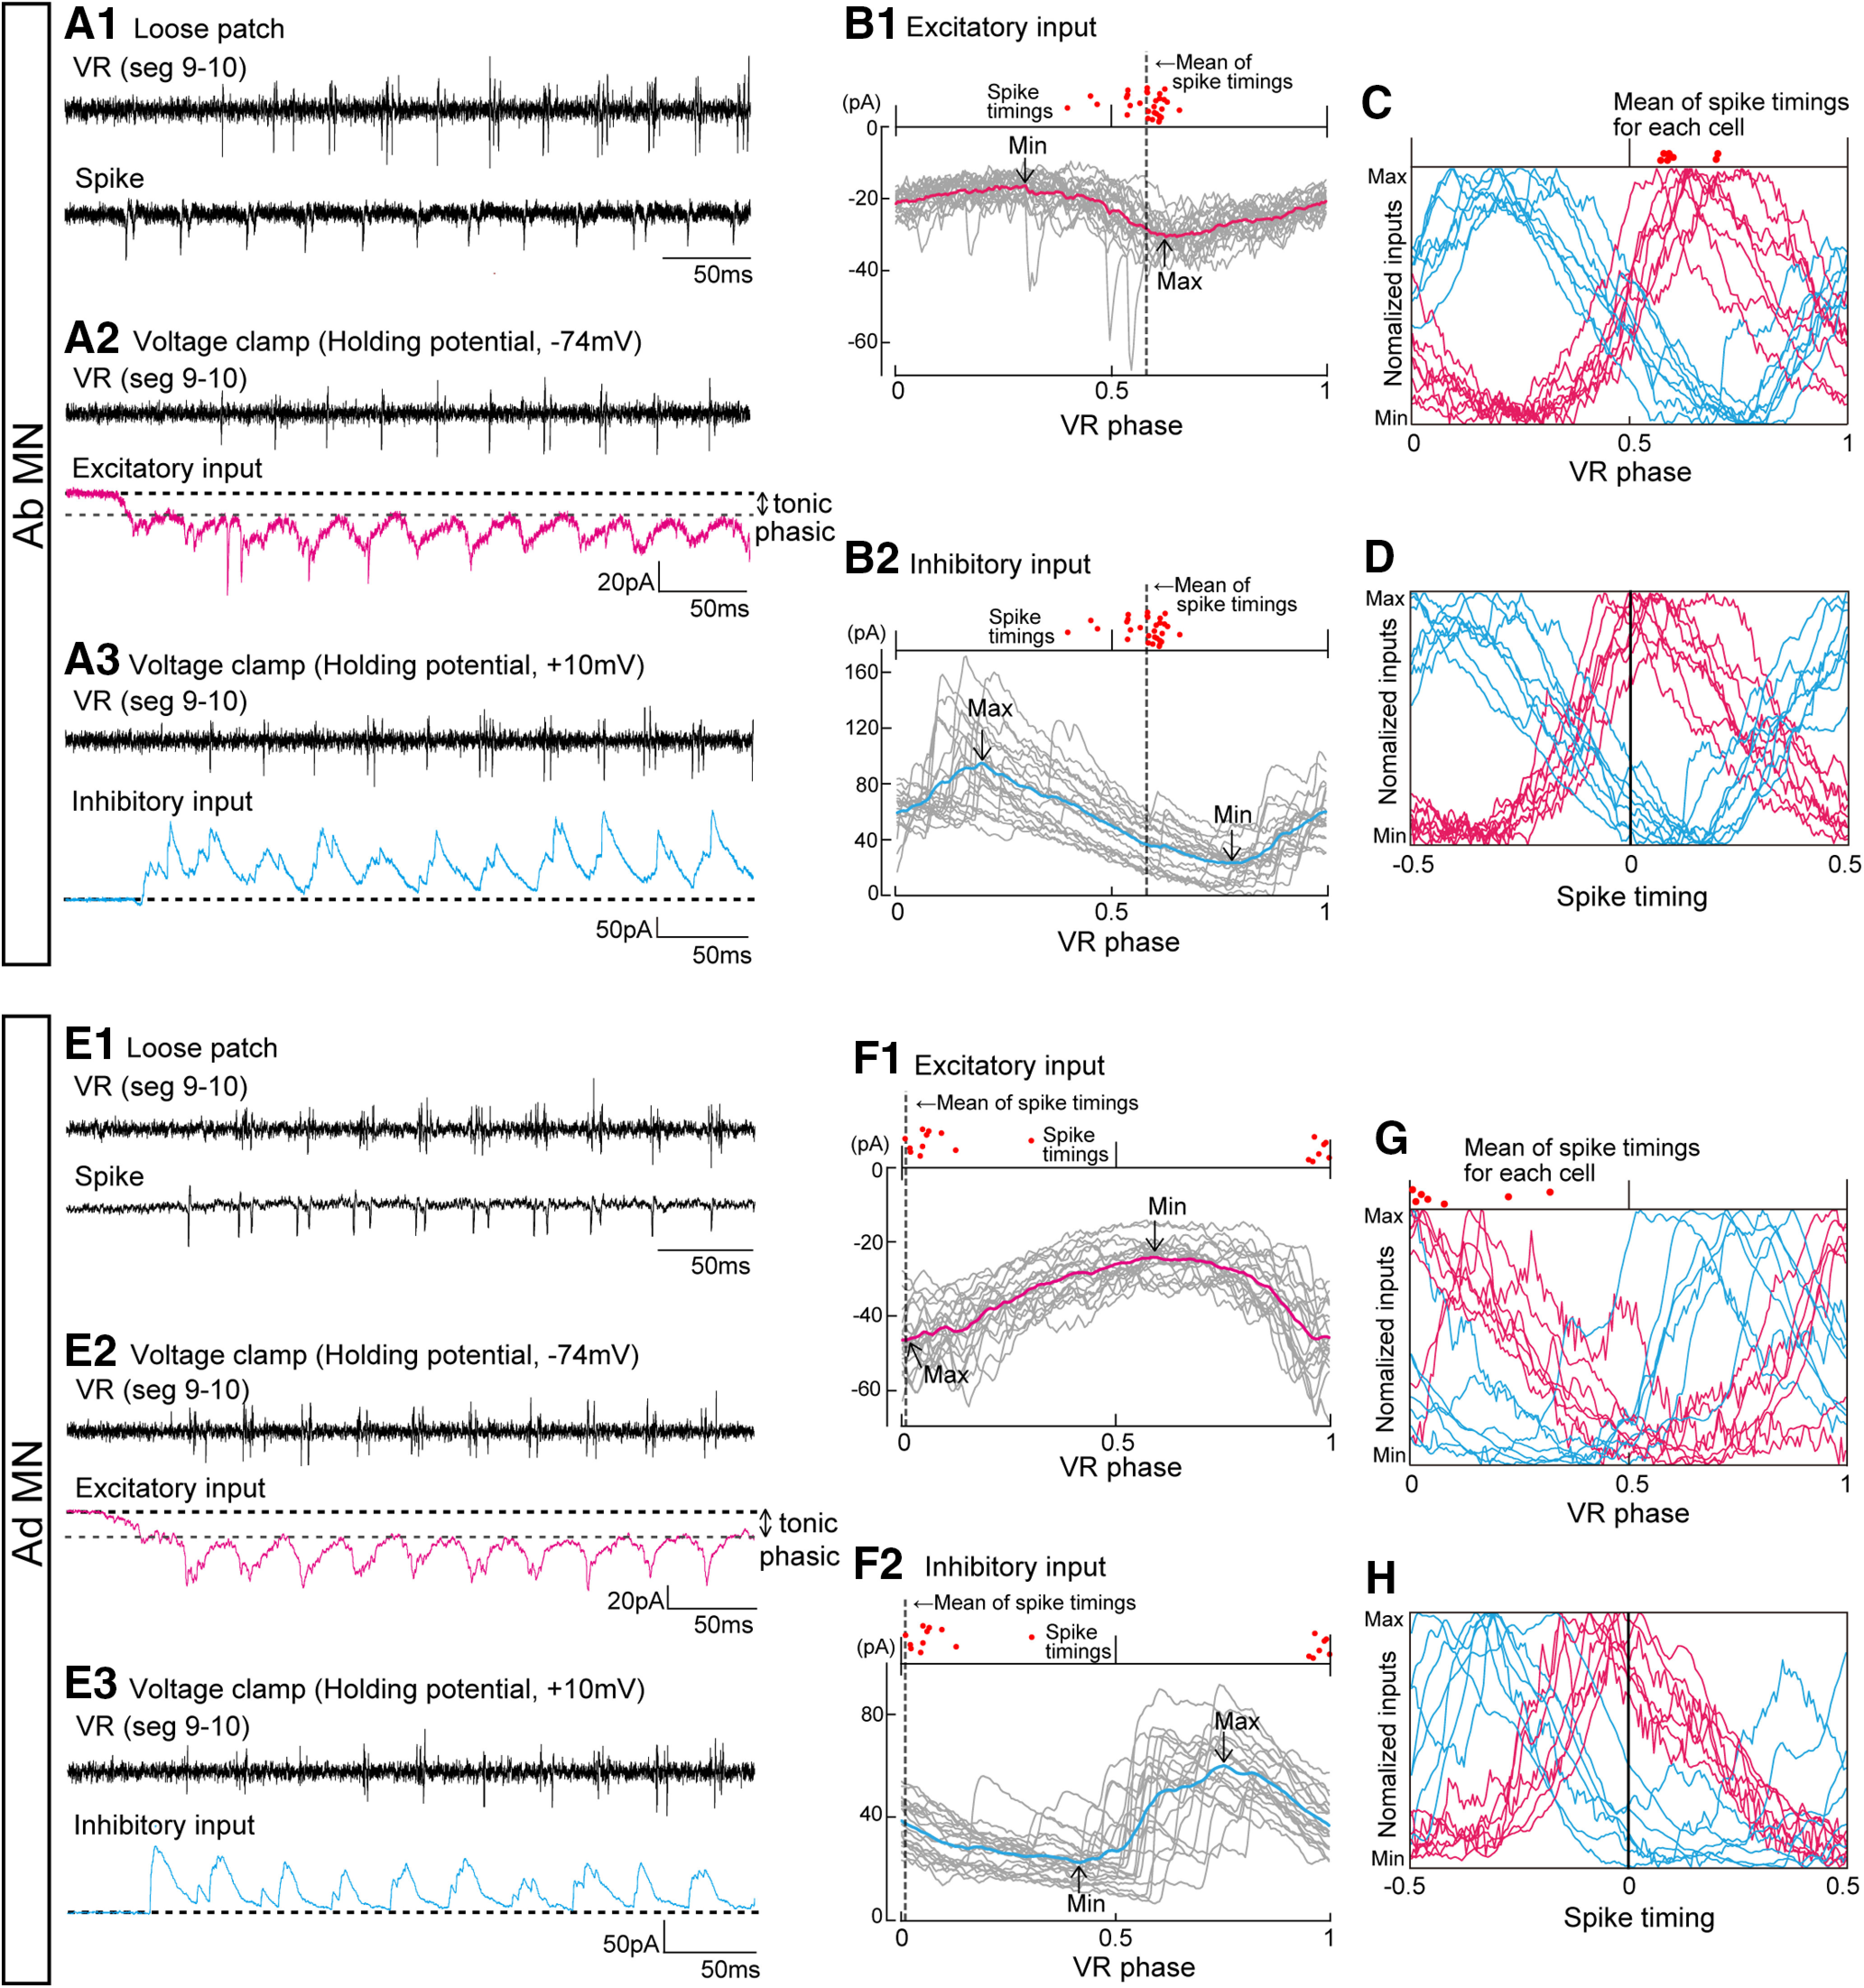
Voltage-clamp recordings from abductor and adductor MNs during fictive swimming. A1, An example of the loose-patch recordings from the abductor MN. A2, Voltage-clamp recording of the same cell with the holding potential at −74 mV. A3, Voltage-clamp recording of the same cell with the holding potential at +10 mV. B1, Twenty traces of voltage-clamp (holding potential at −74 mV) recording from the same cell shown in A are aligned by swim cycles. The average is shown in red. Spike timings (n = 30) of the same cell are shown at the top of the graph (red dots). Mean timing of the spikes is indicated as a dotted line. B2, Same as B1, but with the holding potential at +10 mV. C, Averaged voltage-clamp traces for eight abductor MNs. The vertical axis is normalized to the maximum and minimum values for each trace. Averages of the spike timings of the cells are shown at top of the graph (red dots). D, Same as C, but each trace is aligned with the average spike timing of each cell. E1–E3, Same as A1, A2, and A3, but for the adductor MN. F1, Same as B1 (holding potential at −74 mV), but for the adductor MN (the same cell for E1, E2 and E3). F2, Same as F1, but with the holding potential at +10 mV. G, Same as C, but in adductor MNs (n = 7). H, Same as G, but each trace is aligned with the average spike timing of each cell.
