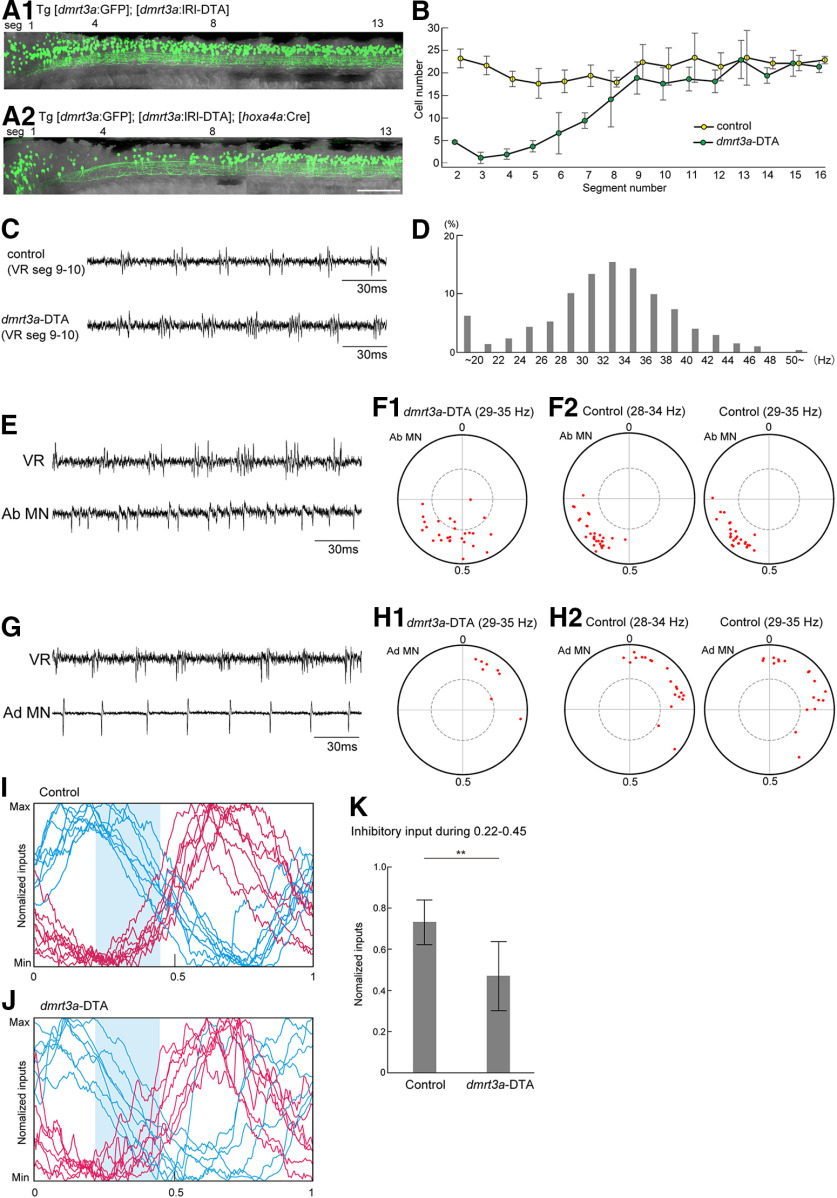
Figure 7.
Genetic ablation of dmrt3a neurons in the rostral spinal cord alters the spiking patterns of abductor MNs. A1, A2, Fluorescent images (green channel) of compound transgenic fish of Tg[dmrt3a:GFP] and Tg[dmrt3a:lRl-DTA] without (A1) or with (A2) the cross to Tg[hoxa4a:Cre]. In the presence of Tg[hoxa4a:Cre], Cre-mediated recombination occurred in the rostral spinal cord, leading to the expression of DTA. This resulted in ablation of dmrt3a (GFP-positive) neurons in the rostral spinal cord (A2). Scale bar, 100 µm. B, Numbers of dmrt3a neurons in each hemisegment in control and dmrt3a-DTA fish (n = 4 for each fish). C, VR recordings from control and dmrt3a-DTA fish. D, Histogram of fictive swimming frequency (1864 cycles from four fish) in dmrt3a-DTA fish. E, An example of the loose-patch recordings from an abductor MNs in dmrt3a-DTA fish. F1, Circular plot showing spike timing of abductor MNs in dmrt3a-DTA fish (n = 27). Swim cycles of 29–35 Hz were subject to the analysis. F2, Circular plot showing spike timing of abductor MNs in control fish. In the left panel, swim cycles of 28–34 Hz were subject to the analysis (n = 30). The same data are shown in Figure 3E. In the right panel, swim cycles of 29–35 Hz were subject to the analysis (n = 27). G, An example loose-patch recording from an adductor MN in a dmrt3a-DTA fish. H1, Same as F1, but for adductor MNs (n = 8). H2, Same as F2, but for adductor MNs. Left, n = 20; right, n = 18. I, Voltage-clamp recordings from abductor MNs in control fish (the same data are shown in Fig. 4C). Shaded area represents the timing of 0.22–0.45. J, The same as I, but for dmrt3a-DTA fish. K, Normalized inhibitory inputs in the timing of 0.22–0.45 in control and dmrt3a-DTA fish. **p < 0.01 (t test, p = 0.0028).

