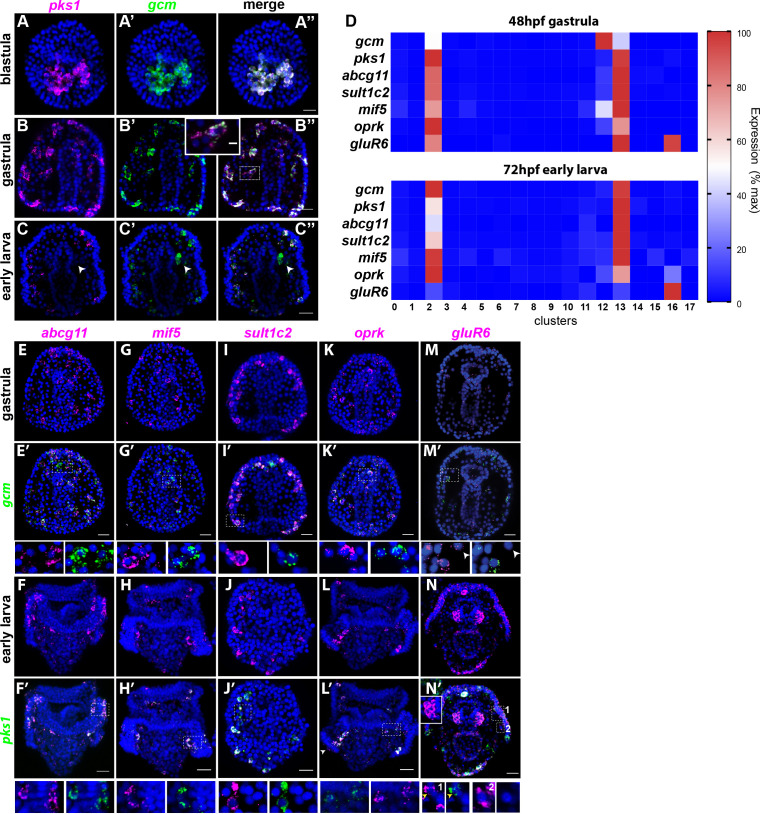
Figure 3. Gene expression in the pigment cells revealed by single cell RNAseq.
(A–C’’) Double fluorescent in situ hybridization (FISH) of the pigment cell markers gcm and pks1. The pks1 and gcm genes are expressed in the same pigment cells in blastulae and gastrulae. Dashed line box indicates the cell magnified in B’’ showing that mRNA for the two genes is expressed in the same cell. In larvae, gcm is expressed in pigment cells and in the left coelomic pouch (white arrowheads). Nuclei are stained in blue (DAPI). (D) Heat map of pigment genes. At 48hpf, gcm is highly expressed in cluster 12, and the other genes are expressed at intermediate levels. At 72hpf gcm expression in cluster 12 decreased and also the expression of the other pigment genes decreased. GluR6 and oprk are also expressed in cluster 16, ciliary band neurons. (E–N’) Double FISH of identified pigment genes with either gcm or pks1 to mark pigment cells in gastrulae and larvae, respectively. Dashed line boxes indicate cells magnified below each picture. Violin and feature plots for the pigment cell genes are shown in Figure 2—figure supplement 2. (M–M’). GluR6 expression in gastrulae is low. In larvae, gluR6 is expressed in pigment cells (yellow arrowheads in J’ inset 1) and in neurons (cluster 16) that appear to be lateral ganglions (inset 1 and 2 white arrowheads in N’). GluR6 is also expressed in both coelomic pouches (inset in N’). Nuclei are depicted in blue (DAPI). Scale bars 50 μm, inset in B’-B’’ scale bar 20 μm. All images are stacks of merged confocal Z sections.

