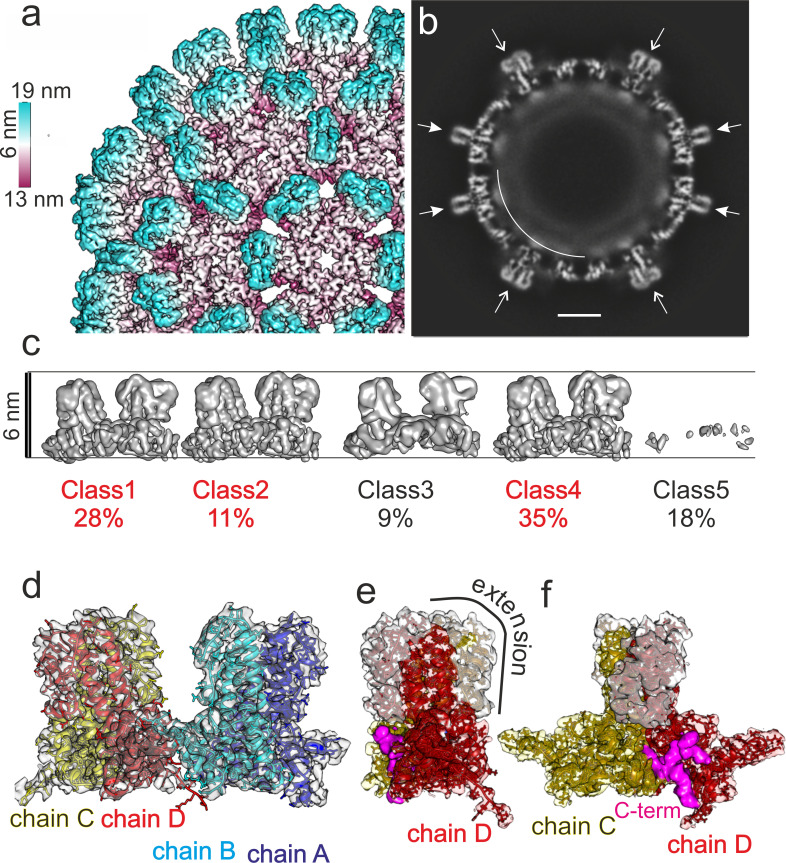
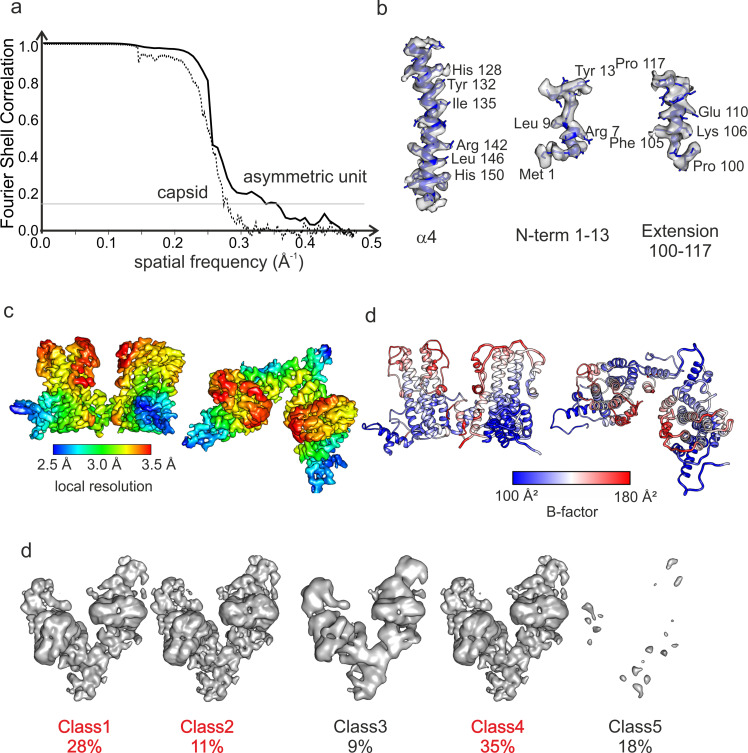
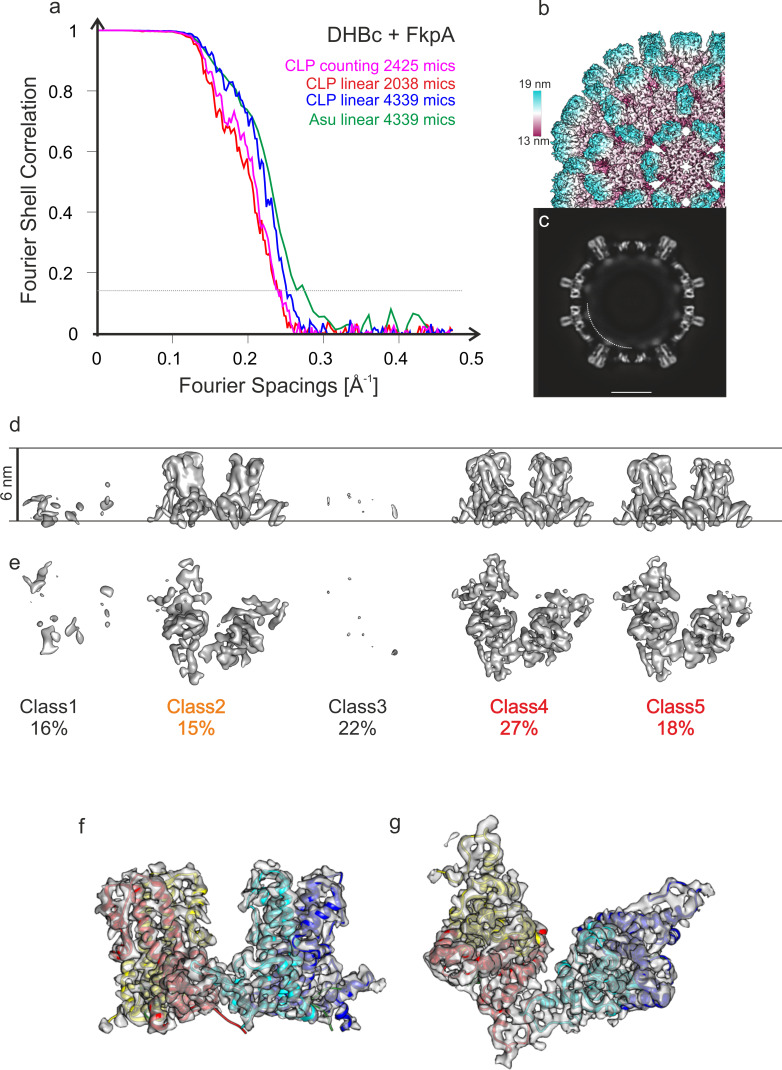
Figure 1. Image reconstruction of CLPs vitrified 10 months after purification.
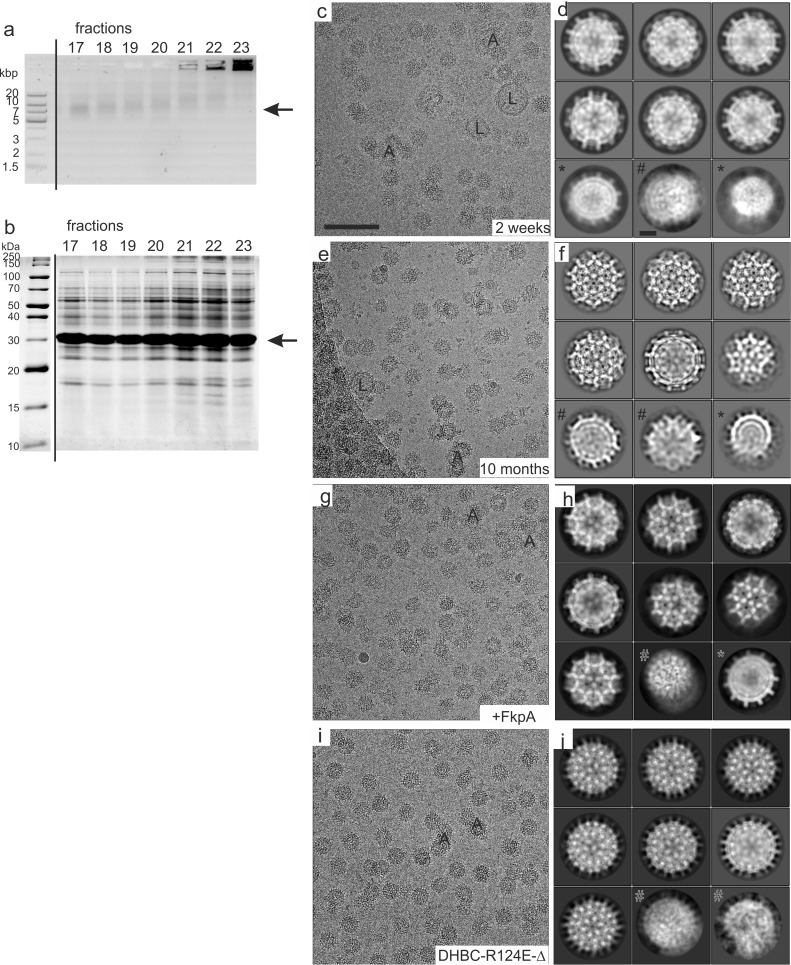
(a) A segment of the capsid color-coded by the radial position. The length of the color key corresponds to 6 nm. For comparison, the capsid of human HBc is shown in Figure 1—figure supplement 1. A representative micrograph and class averages are shown in Figure 1—figure supplement 2. The same sample 2 weeks after purification was less well resolved (Figure 1—figure supplement 3). Conditions for imaging and image processing are summarized in Table 1. (b) An equatorial slice through the EM-density with spikes indicated by arrows (narrow sections: filled arrowheads; wide cross sections: open arrowheads). The diffuse shell of density at the capsid interior is highlighted by a white arch. The scale bar indicates 10 nm. (c) Surface representations of 3D-class averages from the classification of the asymmetric units without alignment. The two horizontal lines indicate the same radial position and are 6 nm apart. Class 1, 2 and 4 differ in their radial positions by up to 2 Å. Class five represents holes in the CLPs. Perpendicular views are shown in Figure 1—figure supplement 4. (d) Model of the asymmetric unit of DHBc fitted into the EM-map. Chain A is shown in blue, chain B in cyan, chain C in yellow and chain D in red. The model validation is summarized in Table 2. The model also fits with the map of DHBc co-expressed with FkpA two weeks after purification (Figure 1—figure supplement 5) (e,f) Perpendicular views of the map of the CD-dimer with the model of the CD-dimer fitted. Density accounted for by the extension domain (79-119) is colored white, the core of chain C in yellow and that of chain D in red. The density at the foot of the spikes (magenta) is neither accounted by the assembly domain of chain C nor of chain D and is modelled with the most C-terminal residues.

