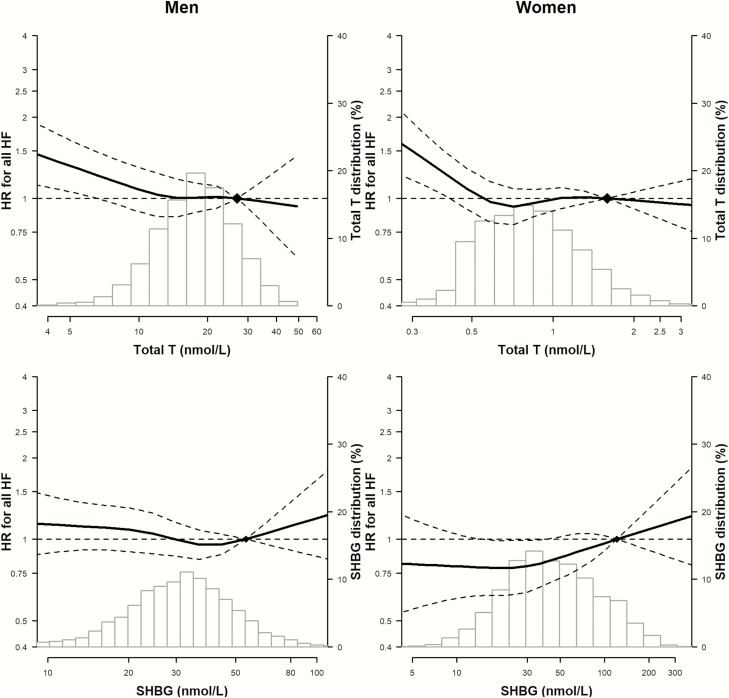
Figure 1.
Hazard ratios for HF and HF subtypes associated with total testosterone, DHEA-S, and SHBG, by sex. The histograms represent the distribution of sex hormones. The curves represent the adjusted HR of any HF by log sex hormone levels from fully adjusted models. The dose–response association was estimated by using a linear and a cubic spline term for sex hormones in the multivariable cox regression. Curves represent adjusted HR (solid line) and 95% confidence interval (dashed lines) based on restricted cubic splines for each sex hormones with knots at the 5th, 35th, 65th, and 95th percentiles of their sample distributions. The reference values (diamonds) were set at the 90th percentile. The model was adjusted for variables in model 3.

