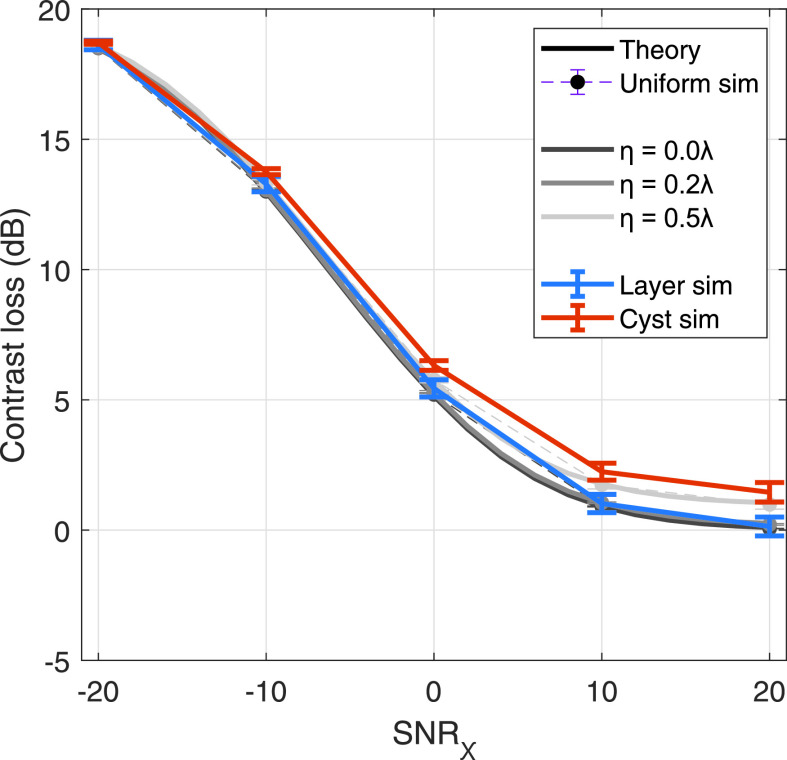
FIG. 7.
Incoherent noise-only contrast loss measurements (CdB,loss,χ), as calculated by Eqs. (13) and (16), for a −20 dB native contrast target. Solid and thin dashed lines over gray scale indicate theory and uniform simulation results over three aberrator strengths (η = 0 to ). Aberration-free, i.e., , contrast values for layer and cyst simulations are shown in blue and red lines, respectively.

