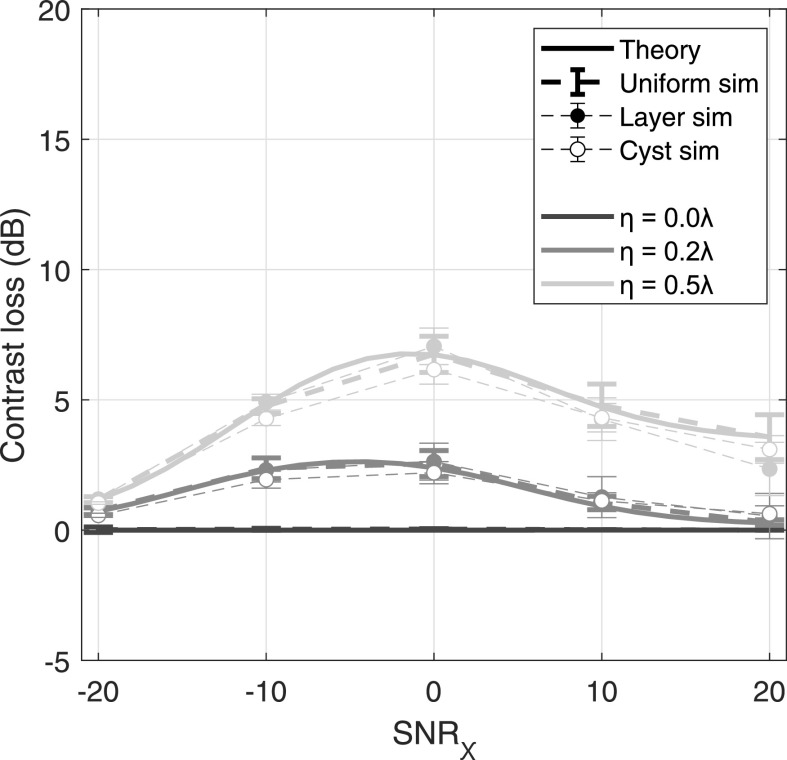
FIG. 8.
Calculated and measured aberration-only contrast loss (CdB,loss,A), as calculated by Eq. (17), for a −20 dB native contrast target. Line style indicates data type: solid line and thick dashed lines indicate theory and uniform simulation results, respectively, and thin dashed lines with filled and unfilled markers indicate layer and cyst simulation results, respectively. Line color indicates aberration severity.

