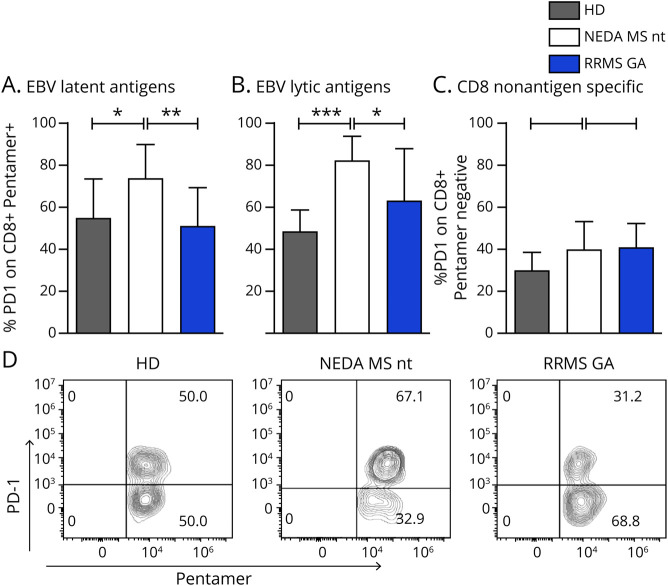
Figure 2. EBV-specific CD8+ T lymphocytes show an exhausted phenotype in untreated patients with MS, which is partially restored by GA treatment.
Frequencies of PD-1+ cells within EBV-specific CD8+ T cells are shown for latent (A) and lytic (B) antigens. PD-1 expression on total CD8+ T cells (C) is shown. Expression of PD-1 was measured in NEDA patients with RRMS without treatment, in patients receiving GA therapy, and in healthy donors. (D) Representative plots relative to 1 HD and 2 patients with MS, untreated or treated with glatiramer acetate. Data for T CD3+CD8+ pentamer + T cells are shown. Mean values and SDs (error bars) are represented. p Values were calculated with the ANOVA and Tukey multiple comparison test. *p < 0.05; **p < 0.01; ***p < 0.001. ANOVA = analysis of variance; EBV = Epstein-Barr virus; GA = glatiramer acetate; HD = healthy donor; NEDA = no evidence of disease activity; nt = not treated; RRMS = relapsing-remitting MS.

