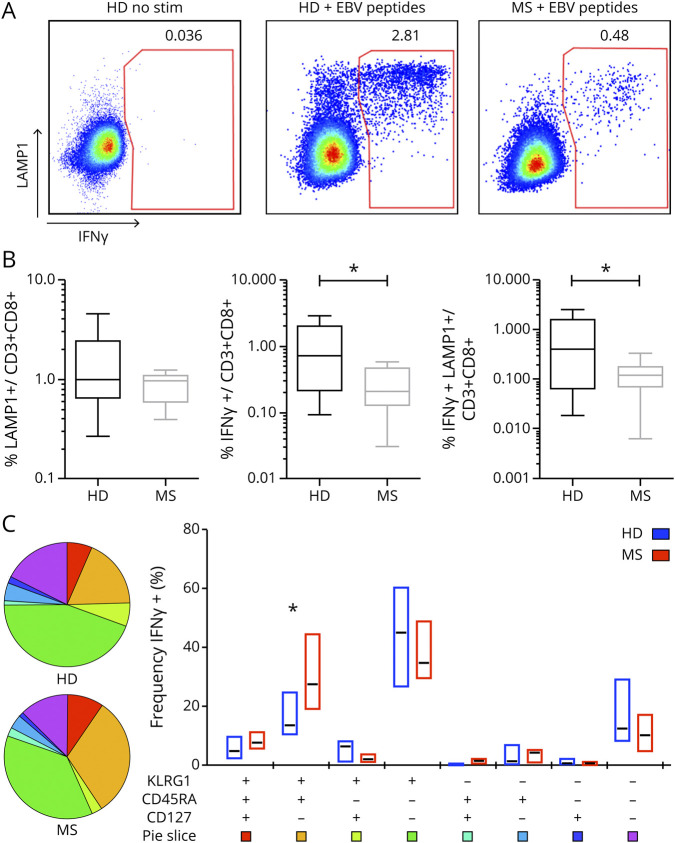
Figure 3. Phenotypic and functional characterization of EBV-specific CD8 T cells.
The frequency of degranulating (i.e., LAMP-1+) and IFNγ-producing (i.e., IFNγ+) CD8 T cells after 18 hours of in vitro stimulation with a mixture of 26 MHC-I restricted EBV peptides was measured by flow cytometry. (A) Pseudocolor plots show the expression of LAMP-1 and IFNγ on total CD8 T cells in 1 representative stimulated and unstimulated HD and 1 representative stimulated patient with RRMS. (B) Frequencies of CD8+ T cells producing IFNγ or LAMP-1 alone or both are compiled and graphed for 10 HDs and 9 untreated patients with RRMS tested. p Values were calculated with the t test. (C) Pie charts and box plots portray the distribution of KLRG1, CD45RA, and CD127 molecules among EBV-responsive, IFNγ+ CD8+ T cells. IFNγ+ cells, successively gated for the 3 markers, are phenotypically inspected by Boolean/combinatorial analysis. In the pie charts, the area of each slice indicates the relative representation of each one of the 8 combinatorial subsets obtained, whereas the same results are conveyed as medians (black lines) with interquartile ranges (boxes) in the adjacent box plot. p Values were calculated with the Wilcoxon rank test. *p < 0.05. EBV = Epstein-Barr virus; GA = glatiramer acetate; HD = healthy donor; IFN = interferon; KLRG1 = killer cell lectin-like receptor G1; LAMP = lysosomal-associated membrane protein 1; NEDA = no evidence of disease activity; RRMS = relapsing-remitting MS; stim = stimulation.

