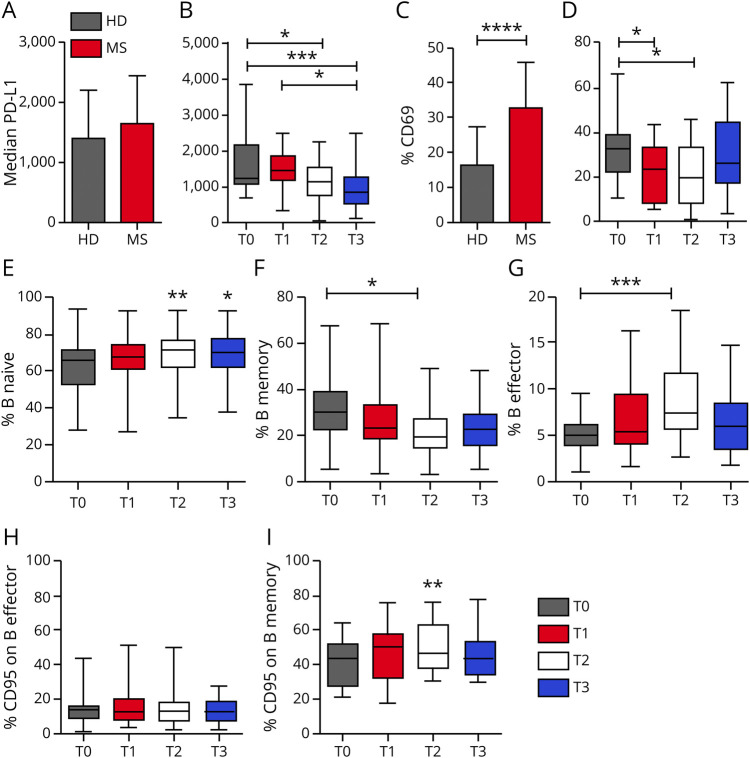
Figure 5. Phenotypic characterization of B cells during GA therapy.
Surface density of PD-L1 on B lymphocytes, measured by median fluorescence intensity, is reported for HDs and patients with RRMS before commencing GA therapy (A, mean values and SDs are indicated) and throughout a 1-year-long longitudinal study (B). Baseline levels were compared with those obtained in samples taken at 3 (T1), 6 (T2), and 12 (T3) months of GA therapy. (C) Cumulative data on the percentage of CD69+ B cells in patients with MS at baseline and HDs. (D) The same measurement as in C (mean values and SDs are indicated) in the follow-up study. Cumulative data are reported for the percentage of naive B cells (E), memory B cells (F), and effector B cells (G) at 3 (T1), 6 (T2), and 12 (T3) months of GA therapy. The percentage of CD95/FAS+ cells among total B cells and among memory B cells of treated patients with MS is reported in (H) and (I), respectively. In the follow-up study, boxes indicate interquartile ranges, whereas whiskers indicate total ranges. (A, C, E, and I) p Values were calculated with the Student t test. (B, D, F, and G) p Values were calculated with the ANOVA and Tukey multiple comparison test. *p < 0.05; **p < 0.01; ***p < 0.001; ****p < 0.000. ANOVA = analysis of variance; GA = glatiramer acetate; HD = healthy donor; RRMS = relapsing-remitting MS.

