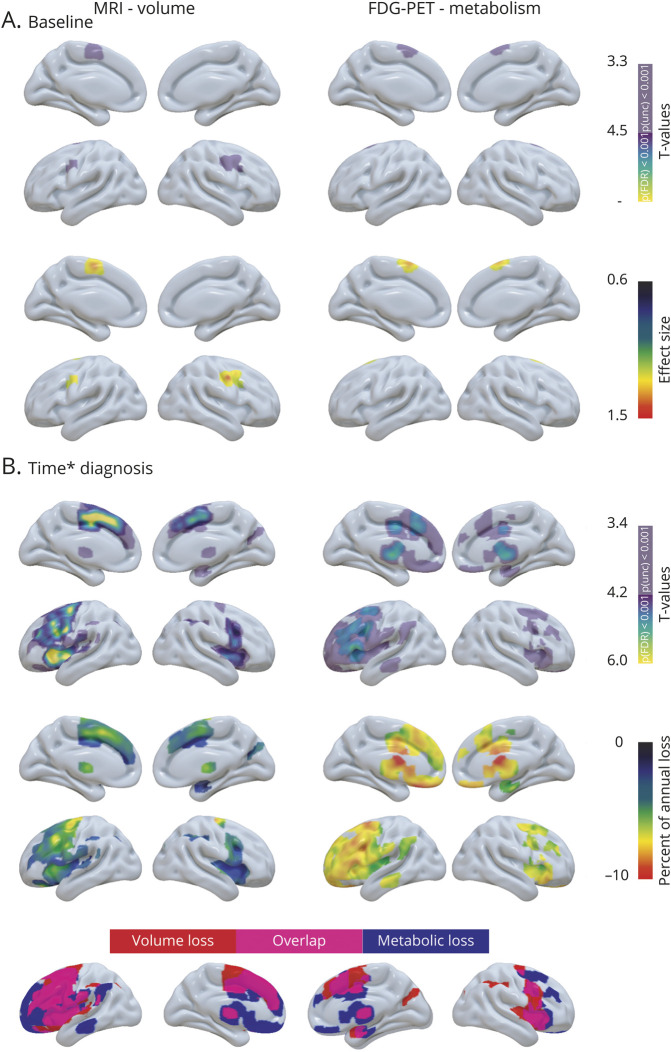
Figure 2. Baseline and longitudinal changes in volume and metabolism in patients with nonfluent variant primary progressive aphasia (nfvPPA).
(A) Results of voxel-wise 2-sample t tests showing brain regions with less volume (left panel) and metabolism (right panel) at baseline in patients with nfvPPA vs cognitively normal (CN) participants. The upper panel shows the significance of the results (T values), and the lower panel shows the effect size. (B) Results of voxel-wise linear mixed effect models showing brain region with greater decreased volume (left panel) and metabolism (right panel) over time in nfvPPA vs CN. The upper panel shows the significance of the results (T values), the middle panel shows the percentage of annual volume/metabolic loss in patients compared to CN, and the lower panel shows the overlap in the patterns of volume and metabolic decline.

