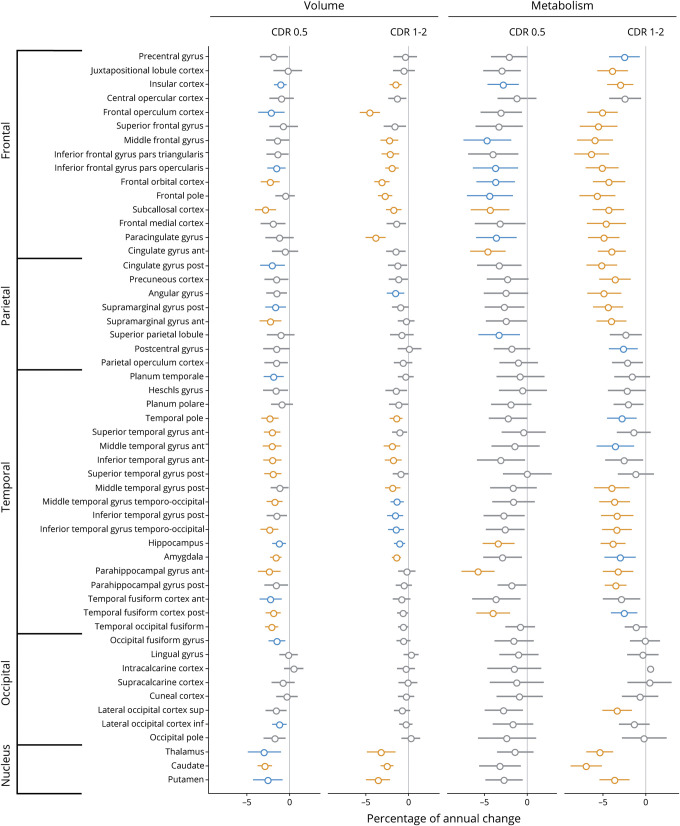
Figure 5. Percentage of annual volume and metabolic loss in patients with behavioral variant frontotemporal dementia (bvFTD) at mild (Clinical Dementia Rating [CDR] 0.5) and moderate (CDR 1–2) stages of the disease.
Results of robust linear mixed effect models comparing patients with bvFTD to cognitively normal (CN) participants for their changes in volume and metabolism in each brain region of the Harvard-Oxford atlas. Values represent the percentage of annual volume changes, with 95% Wald confidence intervals, in patients at mild (n = 10 and n visit = 22) and moderate (n = 20 and n visit = 58) stages of the disease compared to CN. Colors represent the significance of the results: orange: surviving Bonferroni correction for multiple comparisons (α = 0.05, p < 0.0009, 53 models considered); blue: p < 0.01 uncorrected; gray: p > 0.01.

