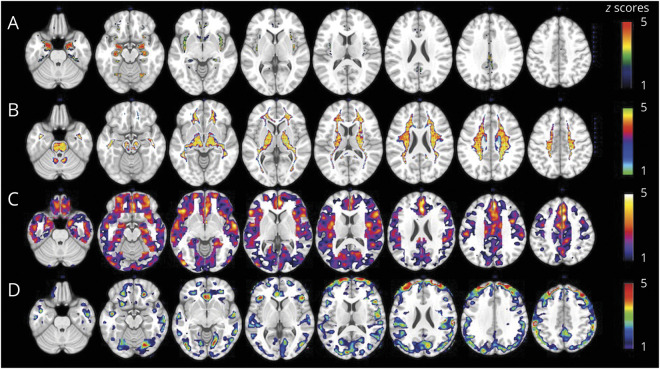
Figure 1. Sex differences in brain AD biomarkers.
(A) MRI gray matter volumes. (B) MRI white matter volumes. (C) Pittsburgh compound B–PET β-amyloid deposition. (D) Fluorodeoxyglucose-PET glucose metabolism. Statistical parametric maps (SPMs) displaying brain regions showing Alzheimer disease (AD) biomarker abnormalities in women vs men are represented on different color-coded scales after being thresholded to standardized z scores: 1 < z < 5, where z > 3 corresponds to p < 0.05 family-wise error corrected. All SPMs are displayed onto a standardized MRI.

