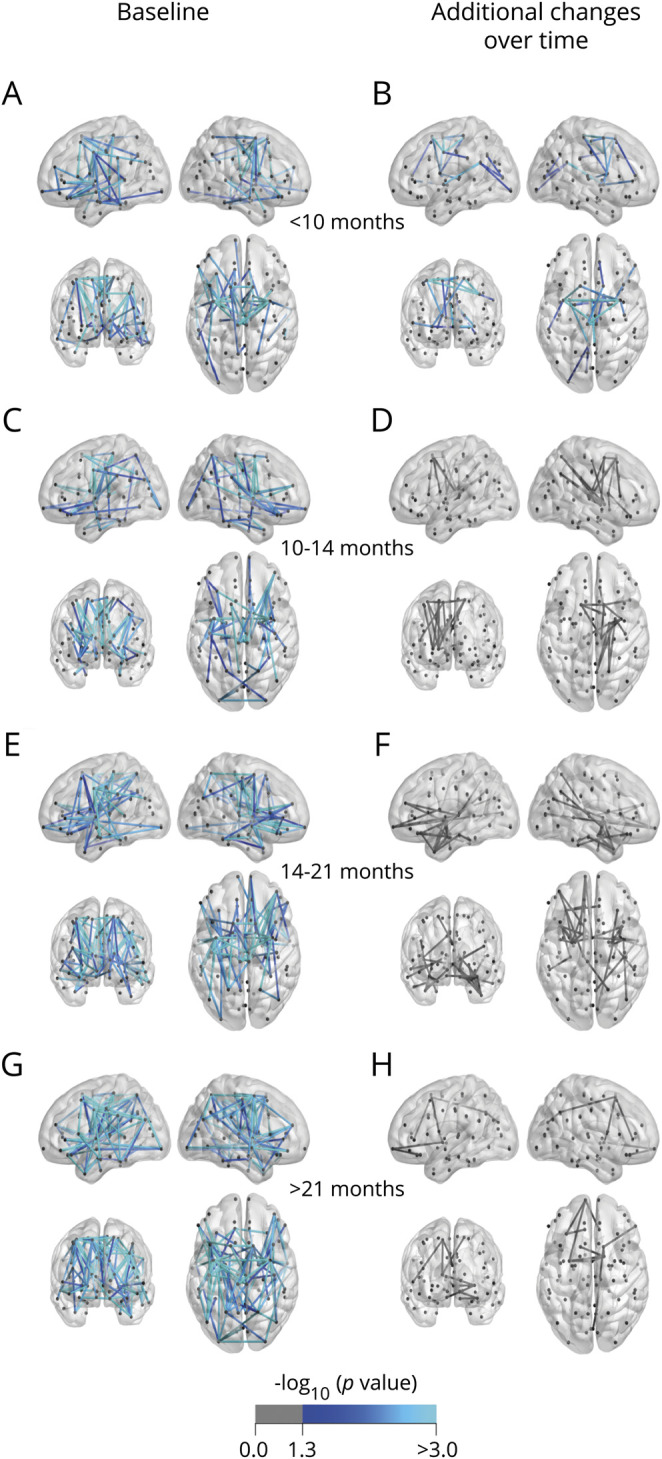
Figure 6. Analysis of connectivity stratified for disease duration.

(A, C, E, and G) Baseline. (B, D, F, and H) Additional effects over time. Patients with a long disease duration show extensive connectivity effects at baseline (121 connections, p < 0.001 [G]) and no significant additional effects over time (H). Patients with a short disease duration show effects centered around the motor network at baseline (65 connections, p = 0.002 [A]) and additional connectivity effects over time (23 connections, p < 0.001 [B]).
