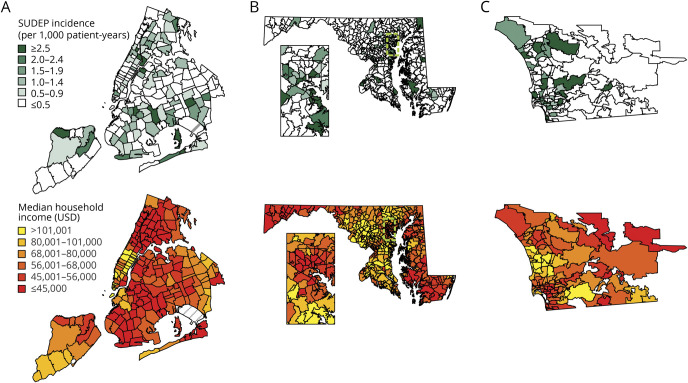
Figure 3. Geographic distribution of estimated SUDEP rates and median household income in all zip codes of 3 regions.
Geographic distribution of estimated sudden unexpected death in epilepsy (SUDEP) rate per zip code based on medico-legal investigation (top) and median household income per zip code (bottom) in 2009 to 2010. (A) New York City medical examiner (ME) cases. (B) Maryland State ME cases with inset (cyan dashed lines) showing Baltimore and surrounding area. (C) San Diego County ME cases. In each region, SUDEP incidence is often higher in zip code areas with lower median household income.

