Abstract
Objective
To investigate the genotype–phenotype correlation between neurofibromatosis 1 (NF1) germline mutations and imaging features of neurofibromas on whole-body MRI (WBMRI) by using radiomics image analysis techniques.
Materials and methods
Twenty-nine patients with NF1 who had known germline mutations determined by targeted next-generation sequencing were selected from a previous WBMRI study using coronal short tau inversion recovery sequence. Each tumor was segmented in WBMRI and a set of 59 imaging features was calculated using our in-house volumetric image analysis platform, 3DQI. A radiomics heatmap of 59 imaging features was analyzed to investigate the per-tumor and per-patient associations between the imaging features and mutation domains and mutation types. Linear mixed-effect models and one-way analysis of variance tests were performed to assess the similarity of tumor imaging features within mutation groups, between mutation groups, and between randomly selected groups.
Results
A total of 218 neurofibromas (97 discrete neurofibromas and 121 plexiform neurofibromas) were identified in 19 of the 29 patients. The unsupervised hierarchical clustering in heatmap analysis revealed 6 major image feature patterns that were significantly correlated with gene mutation domains and types with strong to very strong associations of genotype–phenotype correlations in both per-tumor and per-patient studies (p < 0.05, Cramer V > 0.5), whereas tumor size and locations showed no correlations with imaging features (p = 0.79 and p = 0.42, respectively). The statistical analyses revealed that the number of significantly different features (SDFs) within mutation groups were significantly lower than those between mutation groups (mutation domains: 10.9 ± 9.5% vs 31.9 ± 23.8% and mutation types: 31.8 ± 30.7% vs 52.6 ± 29.3%). The first and second quartile p values of within-patient groups were more than 2 times higher than those between-patient groups. However, the numbers of SDFs between randomly selected groups were much lower (approximately 5.2%).
Conclusion
This preliminary study identified the NF1 radiogenomics linkage between NF1 causative mutations and MRI radiomic features, i.e., the correlation between NF1 genotype and imaging phenotype on WBMRI.
Neurofibromatosis 1 (NF1) is an autosomal dominant neurogenetic disorder caused by mutations in the NF1 gene, located on the long (q) arm of chromosome 17, at band 11.2 (17q11.2).1 To date, 3,329 different NF1 mutations have been reported in the Human Gene Mutation Database,2 ranging from single nucleotide substitutions to large deletions.3 NF1 is the most common neurologic tumor suppressor syndrome, with a birth incidence of approximately 1:3,000–1:5,000.4–6 The diagnosis of NF1 is made mainly via a set of clinical criteria7,8 or via genetic testing.9 NF1 is characterized by a predisposition to develop neurofibromas, the hallmark lesion of the disease, which is a benign nerve sheath tumor composed of Schwann cells, fibroblasts, mast cells, perineurial cells, and collagen.10,11 Pathologically, neurofibromas are classified as discrete neurofibroma (DN: involving a single nerve fascicle) or plexiform neurofibroma (PN: involving multiple nerve fascicles).12
MRI using short tau inversion recovery (STIR) sequence has emerged as the core imaging modality for detecting nerve sheath tumors in patients with NF1.13 Whole-body MRI (WBMRI) with volumetric imaging analysis provides a quantitative imaging biomarker for reliable measurements of tumor burden in patients with NF1. These quantitative measurements are essential for monitoring of tumor progression,14–16 detection of malignant transformation,17 planning of surgical or oncologic treatments, and assessment of tumor response to treatments.8
Radiomics is an innovative image analysis technique used for comprehensive assessment of tumor imaging phenotypes by applying a large number of quantitative imaging biomarkers that describe the imaging characteristics of tumors such as signal intensity (e.g., high or low signal), heterogeneity (e.g., homogeneous or heterogeneous), as well as shapes (e.g., round or spiculated). The identification of the linkage of tumor imaging phenotypes to the underlying genomic composition of the tumor is termed radiogenomics.18 The underlying hypothesis of radiogenomics is that genomic and proteomic patterns can be expressed in terms of macroscopic imaging features (radiomics).19 This hypothesis has been sustained by prior studies in glioblastoma, hepatocarcinoma, and cancers of the lung, head and neck, and breast using both CT and MRI.20–25 However, little is known to date regarding the existence of radiogenomics in NF1, i.e., the correlation between NF1 causative mutations and imaging characteristics of neurofibromas on WBMRI.
The objective of this study was to investigate NF1 radiogenomics, i.e., the genotype–phenotype correlation between NF1 gene mutations and imaging features of neurofibromas on WBMRI, by using radiomics image analysis techniques.
Methods
Standard protocol approvals, registrations, and patient consents
Study patients were selected from a previous WBMRI study performed at our institution, and full informed consent and assent according to the Declaration of Helsinki was obtained from each patient for the original prospective study. Our institutional review board approved this retrospective Health Insurance Portability and Accountability Act–compliant data analysis study, in which informed consent was waived, but patient confidentiality was protected.
Patient cohort
The initial WBMRI study from which this study was derived was a convenience sample of 247 patients in our NF clinic, 141 of whom had NF1. Among those 141 patients with NF1, 40 patients provided consent and blood sample for genetic testing. Inclusion criteria for this study were age ≥18 years, a confirmed pathogenic mutation of NF1, and identified neurofibromas on coronal STIR sequence in WBMRI.
NF1 mutation analysis
NF1 gene mutation was identified in DNA extracted from the immortalized lymphoblasts of each patient using a PureGene DNA isolation kit (Gentra Systems, Minneapolis, MN). Targeted next-generation sequencing (NGS) was utilized for analysis of the entire NF1 gene sequence. The sequence reads were mapped to human reference genome GRCh37 (v.71) using Burrows-Wheeler Aligner tool (v.0.7.5a-r418).26 NF1 gene mutations were identified following the best practices workflow of the Genome Analysis Toolkit (v. 3.1.1),27 and identified mutations were further annotated by ANNOVAR (v.02-01-2016).28
In terms of neurofibromin protein domains related to different biochemical functions,29 we segmented the NF1 mutation fragments into 5 mutation domains (MDs), as shown in figure 1, and mapped the specific mutation locations to mutation domain.
MD-1: aminoacid (AA) 1-542 including the N-terminal
MD-2: AA543-1197 including the cysteine/serine-rich domain (CSRD) and the tubulin-binding domain (Tub)
MD-3: AA1198-1530 including the GTPase activating domain (GAP), which binds Ras
MD-4: AA1531-1816 including the Sec14-like/pleckstrin homology (PH)–like domain (Sec14/PH)
MD-5: AA1817-2818 including the C-terminal domain (CTD) and the syndecan-binding domain (SBD)
Figure 1. Five NF1 mutation domains (MDs).
In terms of protein domains, neurofibromatosis 1 mutations are grouped into 5 mutation domains. CSRD = cysteine/serine-rich domain; CTD = C-terminal domain; GAP = GTPase activating domain; N-term = N-terminal; SBD = syndecan-binding domain; Sec14/PH = Sec14-like/pleckstrin homology–like domain; Tub = tubulin-binding domain.
WBMRI acquisition
Each patient underwent WBMRI using a coronal STIR sequence (inversion time 150 ms, relaxation time 4,190 ms, echo time 111 ms, slice thickness 10 mm, no interslice gap, field of view 500 mm, echo train 25, matrix 320 × 240, 5 imaging stations) on a 1.5T MRI scanner (Siemens Medical Systems, Malvern, PA) with use of the integrated body coil and no IV contrast.15
Image analysis
Tumor volumetric image analysis was performed on our in-house volumetric image analysis software platform, 3DQI (3dqi.mgh.harvard.edu/Project/Intro), which was developed based on open-source packages including Qt (V4.8.4), VTK (V5.10.1), ITK (V5.10), DCMTK (v3.6), and R (V3.3). The 3DQI platform consists of 3 major components for radiomics analysis: image segmentation tool for segmentation of tumors, feature extraction tool for calculation of tumor image texture features, and texture analysis tool for performing radiomics analysis including data visualization, statistical analysis, and machine-learning classification of extracted image features.
Each neurofibroma was identified and segmented by the consensus of a board-certified radiologist and an image analyst, who were both blinded to the mutation data at this stage. Whole-body tumor burden was determined by recording the number, body location, tumor type (DN vs PN), and volume (contours) of individual tumors for each patient. Tumor type was defined in terms of the radiologic appearance; pathologic diagnosis was not required. After completion of tumor segmentation, mutation data became visible to the image analyst, who calculated tumor imaging features and linked with the mutation data for the further radiomics analysis of the study.
For the analysis of image phenotypes of a tumor, we calculated a total of 59 volumetric imaging features for each tumor region segmented. These imaging features were categorized into 6 groups representing the histogram statistics features, image gradient features, run-length (RL) texture features, gray level co-occurrence matrix (GLCM) texture features, shape-based features, and second-order moment features.
Histogram features: The histogram of a tumor region was constructed using 200 bins with bin size of 4. The histogram was normalized in terms of the size of the tumor (the number of voxels). A set of 14 histogram statistics features such as mean, SD, skewness, kurtosis, energy, and entropy was calculated.30
Image gradient features: The 3D image gradient was calculated using a Gaussian convolution with an SD σ of 1.5 of voxel size. The mean and SD of the gradients within a tumor region were calculated.
RL texture features: 11 RL textures were derived from an RL matrix characterizing the image coarseness, where an RL matrix p(i;j) is defined as the number of runs with pixels of gray level i and run length j. The number of RL bins was set to 200. Fine textures tend to contain more short runs whereas coarse textures have more long runs.30
GLCM texture features: 22 GLCM textures were extracted from a GLCM describing the gray-level spatial dependence, where a GLCM is created by calculating how often pairs of pixels with specific values and in a specified spatial relationship occur in an image.31 The number of GLCM bins was set to 200.
Shape-based features: 7 shape features were calculated, depicting the spatial shape of a tumor such as sphericity and compactness.32,33
Second-order moment features: 3 second-order central-moment invariants J1, J2, and J3 describing the stretched/shrunk factors of a tumor along derivatives were calculated.34
The above 59 imaging features composed the image phenotypes (radiomics) of NF1 represented by a large vector that characterizes the signal intensity features and shape features of each segmented tumor. No preprocessing such as noise reduction was applied while we calculated the imaging features, for preservation of the original image phenotypes.18 We have observed that the STIR sequence may have different signal intensity ranges from different vendors' scanners. The STIR signal intensity of interest in this study was set between 100 and 900, which covers the range of STIR signal intensity of NF. Voxels below 100 were removed to prevent background voxels in tumor segmentation, while those above 900 were rounded to 900.
For visualization of imaging features calculated, we used the heatmap tool, which is a data visualization technique for gene expression analysis,35 and is well accepted as one of the main analysis tools for high-dimensional genomic data and other -omics data. A heatmap may also be combined with clustering methods that group genes together based on the similarity of their gene expression patterns.36 This analysis tool can be very effective for identifying genes that are commonly regulated, or biological signatures associated with a particular condition (e.g., a disease or an environmental condition).37
To identify NF1 image feature patterns on WBMRI, we constructed the radiomics heatmap by using the complex heatmap method.38 In the radiomics heatmap, data are displayed in a grid where each row represents a radiomic feature (i.e., 1 of the 59 imaging features calculated) and each column represents a radiomic sample of an NF1 lesion. The color and intensity of a box represents the Z score (not absolute value) of a radiomic feature, which is the number of SDs away from the mean value of a radiomic feature. Z score can be used to determine whether a radiomic feature is upregulated or downregulated relative to all other tumor samples. To group similar feature patterns and similar Z score values, we applied unsupervised hierarchical clustering using Euclidean distance and complete-linkage criteria39 of the above 59 imaging features across all resampled lesion features per tumor or per patient to reorder both columns (radiomics patterns) and rows (radiomics values) in the heatmap. Consequently, similar imaging features were clustered together to form one feature pattern, which represented the underlying WBMRI radiomics pattern shared by a group of NF1 lesions. The per-tumor and per-patient genotype distributions within each feature cluster were calculated to identify the NF1 radiogenomics, i.e., the association between the NF1 genotype and image phenotype on WBMRI. To assess the association between genotype and phenotype, we conducted 3 statistical tests to determine whether tumor radiomic features within the same groups of mutation domains or types are more similar than those between groups with and without mutation. One-way analysis of variance test was performed to evaluate whether a feature is significantly different in terms of the null hypothesis H0: there is no difference for the feature between 2 groups of samples. This null hypothesis was rejected when p < 0.05 and we claimed that this feature was significantly different between 2 groups, i.e., a significant different feature (SDF).
Test 1: Within-group similarity test
Patients were divided into groups by 5 mutation domains (MD-1 through MD-5) and also by 4 mutation types (MT-1 through MT-4). There was an average of 10 tumors per patient. Within each mutation type or mutation domain, we sampled 10 tumors per patient at random with replacement using the synthetic minority over-sampling technique (SMOTE) method.40 A one-way analysis of variance model was fit with patient ID as a fixed factor for each radiomic feature in each of the 9 data groups corresponding to the mutation domain and mutation type. The F test for significance of patient ID was used to test whether a feature was an SDF between patients within a data subset. Patient ID was treated as a fixed effect, rather than a random effect, because the number of patients per data subset was small (between 2 and 5).
Test 2: Between-group similarity test
For each mutation domain or mutation type, patients were divided into those with and without the mutation. The SMOTE method was used as above to balance the number of tumors in each group, resampling 50 tumors per group. For each radiomic feature, a linear mixed-effect model was fit with presence of mutation as a fixed effect and patient ID as a random effect. The test of significance of presence of mutation was used to test whether a feature is an SDF between patients with and without the mutation.
Test 3: Between-random-group similarity test
We performed a random permutation test to estimate the similarity of tumor radiomic features in the study cohort. First, all tumors in each of 5 mutation domains or 4 mutation types were resampled using the SMOTE method to have 50 tumors. We then randomly permuted the label, which associated presence or absence of mutation. We then performed the between-group similarity analysis as described above for test 2. This permutation test was replicated 1,000 times.
Statistical analysis
To identify genotype–phenotype correlations, a χ2 test followed by a Cramer V test was performed to evaluate the significance and the strength of association between the imaging feature clusters and the genomic properties, e.g., the tumor gene mutation domains and types, in both per-tumor and per-patient heatmaps. The null hypothesis was that the clustering of the tumor radiomics features is independent of their genomics properties. We estimated the p value, the χ2 value, the degrees of freedom, and the effect size Cramer V value for measures of statistical associations. A p value less than 0.05 rejects the null hypothesis and indicates a statistically significant association between radiomics feature clusters and genomics data. A Cramer V of <0.20, 0.20–0.40, 0.40–0.60, or >0.60 indicates weak, moderate, strong, and very strong association, respectively.
All statistical analyses were performed by using the open-source statistical programming language R (V3.3.1) on the related IDE RStudio (V0.99.903) (rstudio.com/).41
Data availability
Anonymized data will be shared by request from any qualified investigator: (1) gene sequencing results of 29 patients; (2) the tumor type and location of 218 neurofibromas identified on WBMRI in 19 of the 29 patients; (3) the NF1 gene mutation and tumor numbers in 19 of the 29 patients with at least 1 neurofibroma identified on WBMRI (doi.org/10.5061/dryad.bd87805).
Results
From 40 tested specimens, 29 patients had confirmed NF1 mutation determined by targeted NGS. Of 29 patients (11 male, 18 female; mean age 41 ± 12 years) who had a confirmed pathogenic mutation in the NF1 gene, 19 patients (8 male, 11 female; mean age 40 ± 12 years) had at least 1 internal neurofibroma reliably identified on WBMRI. No tumors were identified in the other 10 patients (3 male, 7 female; mean age 42 ± 13 years). There is no statistically significant difference in age (p = 0.707) or sex (p = 0.694) between NF1 pathogenic confirmed patients with and without tumors identified on WBMRI.
In 19 patients with at least 1 MRI-identified internal neurofibroma, the distributions of gene mutation types were splice-site (n = 5 [26.3%]), nonsense (n = 4 [21.1%]), frameshift (n = 5 [26.3%]), and missense (n = 5 [26.3%]); and the distributions of mutation domains were MD-1 (n = 3 [15.8%]), MD-2 (n = 5 [26.3%]), MD-3 (n = 3 [15.8%]), MD-4 (n = 2 [10.5%]), and MD-5 (n = 6 [31.6%]). For the 10 patients without MRI-identified internal neurofibroma, the distributions of gene mutation types were splice-site (n = 3 [30%]), nonsense (n = 2 [20%]), frameshift (n = 3 [30%]), and missense (n = 2 [20%]); and the distributions of mutation domains were MD-1 (n = 1 [10%]), MD-2 (n = 2 [20%]), MD-3 (n = 2 [20%]), MD-4 (n = 1 [10%]), and MD-5 (n = 4 [40%]). Comparing the relative frequency distribution of mutation type/domain in 2 groups who had and did not have identifiable neurofibromas on WBMRI, we observed that there were no statistically significant differences (p = 1.00) for NF1 gene mutation type/domain for these 2 groups of patients.
Volumetric image analysis of NF1 tumors
Of the 19 patients who were both mutation-positive and WBMRI-positive, a total of 218 neurofibromas (97 DN and 121 PN) were identified. The number of lesions per patient ranged from 1 to 42. Of 218 identified neurofibromas, 56% (121/218) of lesions were plexiform but these tumors contributed 92% of the total tumor volume. The median tumor volume was 43.3 mL for PN and 6.1 mL for DN. Locations of neurofibromas were categorized into 12 different body regions: head/neck (n = 9), thorax (n = 41), abdomen (n = 22), pelvis (n = 30), left/right arm (n = 20), left/right leg (n = 72), thorax and left/right arms (n = 8), as well as pelvis and left/right leg (n = 16). The distributions of gene mutation types were splice-site (n = 102 [46.8%]), nonsense (n = 8 [3.7%]), frameshift (n = 62 [28.4%]), and missense (n = 46 [21.1%]), and the distributions of mutation domains were MD-1 (n = 48 [22.0%]), MD-2 (n = 54 [24.8%]), MD-3 (n = 34 [15.6%]), MD-4 (n = 17 [7.8%]), and MD-5 (n = 65 [29.8%]).
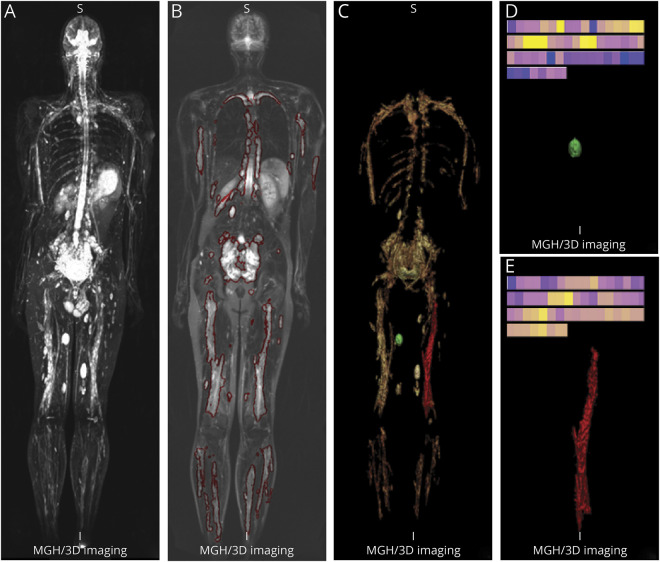
Figure 2 demonstrates the results of the volumetric image analysis of the index patient 12, who had a total of 40 lesions (13 DN, 27 PN). The total tumor volume was 4,116 mL (DN: 148 mL; PN: 3,968 mL). For individually segmented tumors, we calculated the radiomics sample (a set of 59 image features), which is represented in the color-coded bar displayed at the top of panels D and E respectively for the indexed DN and PN in panel C.
Figure 2. Volumetric image analysis of whole-body MRI.
Volumetric image analysis of patient 12 (a 27-year-old man with neurofibromatosis 1 [NFl]) imaged by whole-body MRI using short tau inversion recovery sequence. (A) 3D maximum intensity projection image of coronal view. (B) One coronal slice with segmented NFl lesions marked by red contours. (C) 3D volume-rendering image of all segmented NFl lesions: green is discrete neurofibroma (DN); red is plexiform neurofibroma (PN). (D) Detail view of the segmented DN marked green in C) and its color-coded bar of radiomics samples. (E) Detail view of the segmented PN (marked red in C) and its color-coded bar of radiomics samples.
Radiogenomics analysis of tumors and patients
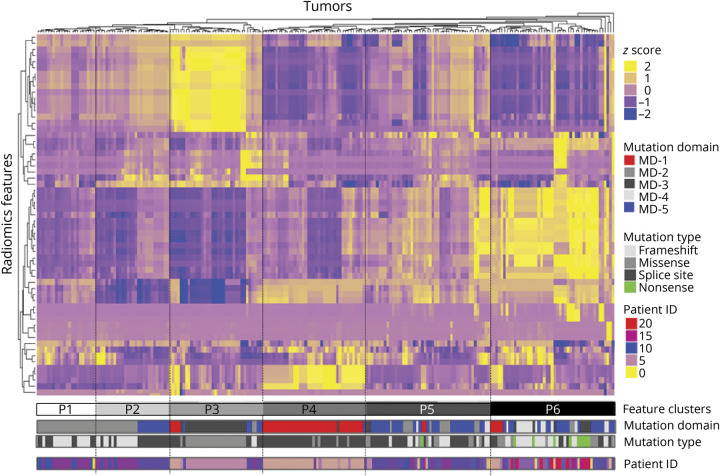
The per-tumor radiomics heatmap of 218 radiomics samples is shown in figure 3, in which yellow represents upregulated imaging features and blue represents downregulated imaging features. Six feature clusters (P1–P6) were identified in the radiomics heatmap by the unsupervised hierarchical clustering of 59 imaging features. We observed that NF1 lesions with the same mutation domains and mutation types were sorted together by their image feature patterns. Statistical analysis showed per-tumor genotype–phenotype correlations between image feature patterns and NF1 mutation type (χ2[15] = 162.25; p < 0.001) and mutation domain (χ2[20] = 302.15; p < 0.001), respectively. In addition, we calculated the Cramer V to determine the strengths of radiomics association between image feature patterns and NF1 mutation type (V = 0.524) and mutation domain (V = 0.650), respectively. These values of Cramer V indicated a strong to very strong genotype–phenotype association.
Figure 3. Per-tumor radiomics heatmap.
Radiomics heatmap generated by unsupervised hierarchical clustering of 59 imaging features (Y axis) across 218 identified neurofibromatosis 1 (NFl) lesions on X-axis revealed 6 major image feature patterns. The corresponding NFl mutation gene domain, mutation type, and patient ID that the tumor was derived from are shown underneath the color bars.
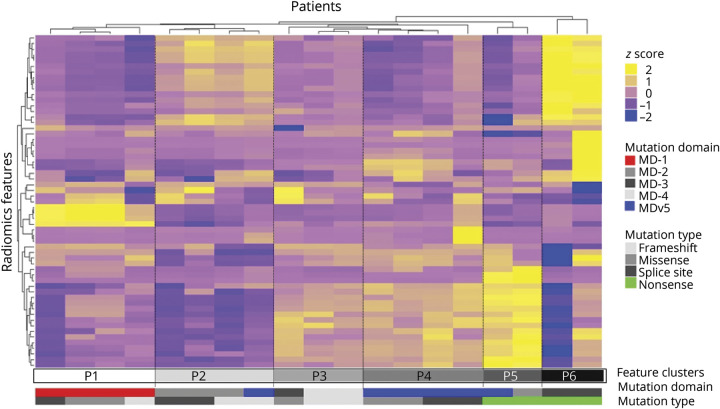
In figure 4, we show the per-patient radiomics heatmap of 19 patients by combining tumor radiomics samples in each patient. The Fisher exact test revealed p value of 0.0098 (χ2[20] = 55.55) and Cramer V = 0.855 for mutation domain and p value of 0.0297 (χ2[15] = 27.23) and Cramer V = 0.691 for mutation type. This indicated that there is a very strong per-patient genotype–phenotype association between the NF1 mutation types/domains and imaging features of tumors on WBMRI. Comparing the per-tumor and the per-patient analysis, the latter may less affected by the within-patient clustering of tumor characteristics.
Figure 4. Per-patient radiomics heatmap.
Per-patient radiomics heatmap generated by unsupervised hierarchical clustering of 59 imaging features (Y axis) across 19 patients (X axis) who tested positive for pathogenic mutation of neurofibromatosis 1 (NFl) and had at least 1 neurofibroma identified on whole-body MRI revealed 6 major image feature patterns. The corresponding NFl mutation gene domains and mutation types are shown underneath the color bars.
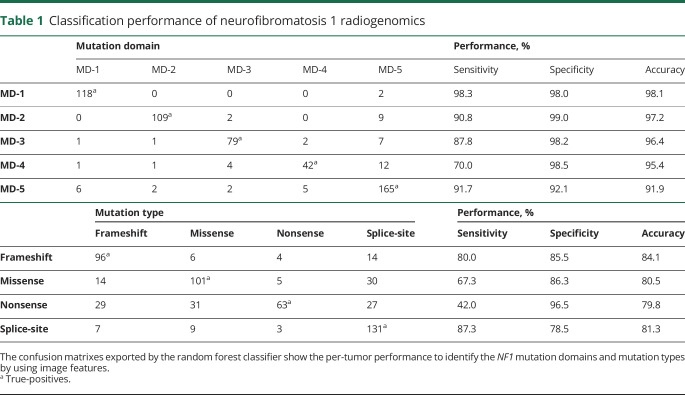
Per-tumor classification performance predicting mutation domains and mutation types is shown in table 1, which was exported by the 10-fold cross-validation of random forest classifier. In prediction of mutation domains, the classifier shows the best performance to identify N-term mutation gene fragment (MD-1) with 98.1% accuracy (98.3% sensitivity and 98.0% specificity), relatively strong performance for identification of other mutation domains in terms of accuracy. In terms of sensitivity, we observed strong performance to identify CSRD and Tub gene fragment (MD-2), GAP (MD-3), and C-term including CTD and SBD (MD-5), and fair performance to identify Sec14/PH (MD-4) gene fragments. In mutation type, the image features have the best sensitivity to predict the splice-site and frameshift mutation types with sensitivity and specificity above or around 80%, and fair performance to identify other mutation types.
Table 1.
Classification performance of neurofibromatosis 1 radiogenomics
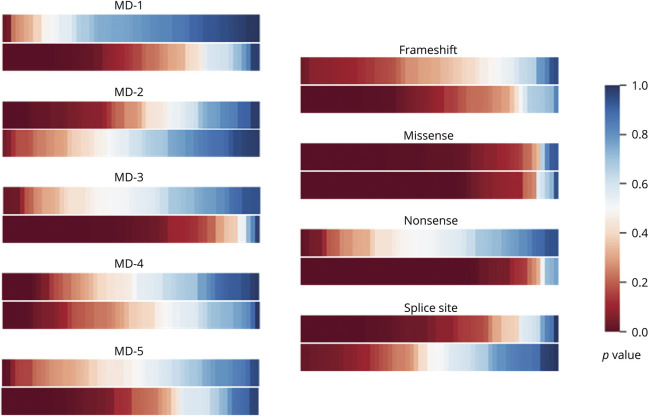
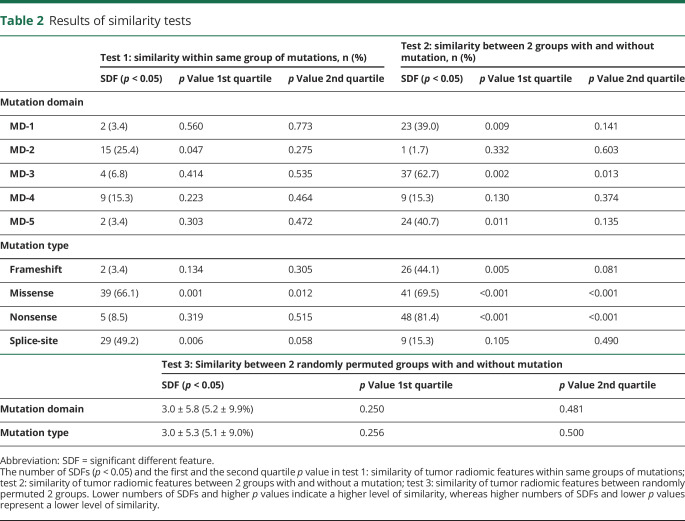
Figure 5 compares the overall p value distributions of features in each group of 5 mutation domains and 4 mutation types in the within-patient similarity test (test 1) and the between-patient similarity test (test 2). We observed that radiomics features in 4 out of 5 mutation domains (except MD-2) and 3 out of 4 mutation types (except splice-site) are more similar within same mutation groups than those between mutation groups. In table 2, we list the numbers of SDFs in the within-patient similarity test (test 1) and the between-patient similarity test (test 2). The number of SDFs within the same mutation domains (10.9 ± 9.5%; median 6.8%) and mutation types (31.8 ± 30.7%; median 31.8%) (test 1) are much lower than those between patient groups with and without the corresponding mutation domains (31.9 ± 23.8%; median 39.0%) and mutation types (52.6 ± 29.3%; median 56.8%) (test 2). However, the first and the second quartile p values of within-patient groups (test 1) were more than 2 times higher than those between-patient groups (test 2). For instance, the first quartile p values were 0.309 ± 0.194 (within-patient) versus 0.097 ± 0.142 (between-patient) for mutation domain, and were 0.115 ± 0.149 (within-patient) versus 0.028 ± 0.052 (between-patient) for mutation types.
Figure 5. Color maps of overall p values in the within-patient and between-patient tests.
Comparison of the overall p values of features in each group of 5 mutation domains and 4 mutation types. In each comparison group, the upper color bar shows the p values in the within-patient similarity test (test 1) and the lower color bar corresponds to the between-patient similarity test (test 2).
Table 2.
Results of similarity tests
In the between-random-group similarity test (test 3), the mean numbers of SDFs were 3.04 ± 5.82 (5.2 ± 9.9%, median 1.7%) and 2.98 ± 5.29 (5.1 ± 9.0%, median 1.7%) after 1,000 repeats of the random permutation tests in terms of 5 mutation types or 4 mutation domains, respectively, with no statistically significant difference (p = 1.0). The number of SDFs in this between-random-group test (test 3) was significantly lower than those between groups with and without mutations (test 2), along with the higher first and second quartile p values in the between-random-group test, indicating that the mutation domains or types are associated with underlying radiomics features, i.e., the existence of NF1 phenotype–genotype associations in WBMRI.
Discussion
In this preliminary study, we investigated NF1 radiogenomics on WBMRI, in specific, NF1 gene mutation domains, and mutation types are associated with underlying tumor imaging features, i.e., the NF1 genotype–phenotype correlation on WBMRI. Both machine-learning heatmap and statistical tests of feature similarity evidenced the genotype–phenotype correlation.
The term “radiogenomics” refers to the hypothesized relationship between imaging phenotype and disease genotype or gene expression.19 This hypothesis has been sustained by prior observational studies on both CT and MRI. Early studies suggested that imaging-based biomarkers quantifying tumor heterogeneity were related to tumor angiogenesis and the growth factor expression of lesions in the breast and the liver in MRI,42 the gene expression differences and the overexpression of epidermal growth factor receptor in glioblastoma in MRI,20 the different gene modules in hepatocellular carcinomas in CT,21 and the nucleotide variations in 5 genes in renal cell carcinoma.43 Radiogenomics can also predict prognosis or therapeutic response in patients with lung or head and neck cancer.18 In a recent study, a combination of 28 image features was used as a surrogate of molecular assay to predict disease-specific survival in patients with clear-cell renal cell carcinoma.44
Little is known regarding NF1 genotype–phenotype correlation. Certain biological correlations have been established in regard to the complete deletions of NF1, which are associated with severe clinical phenotypes (cognitive defects, body or facial dysmorphisms, early onset of cutaneous neurofibromas), and truncating mutations, which are associated with increased risk of cancers.45 In addition, altered endocrine function has been reported in association with NF1 mutation in preliminary clinical report.46 Notably, few imaging correlative studies have been conducted to identify NF1 genotype–phenotype correlation. An early study revealed that higher numbers of plexiform tumors, larger whole-body internal tumor volume, and younger age are important risk factors for malignant peripheral nerve sheath tumors.17 This study investigated the genotype–phenotype linkage between NF1 gene mutation and tumor imaging features on WBMRI using radiomics image analysis techniques.
We employed a set of 59 image features in this study, which covers a variety of statistical textures and shape features in image analysis. Instead of using bandpass or spatial filters for preprocessing of images, we examined these features in their raw state without any preprocessing or correction. Such raw imaging features may capture important radiomic and radiogenomic features in 3D space.18 Although bandpass filters may remove image noise and are expected to generate less-noisy images, they may also induce artifacts or remove important data when extracting features. In our study, we used 3D texture analysis based on our volumetric tumor segmentation. 3D texture analysis is more objective and comprehensive compared to manually contoured 2D regions of interest.
Considering the imbalanced number of tumors per patient, which may bias our observations due to within-patient clustering artifact, we used the SMOTE resampling method40 to balance the radiomics sampling number in the statistical analysis. As a result, larger and less specific regions are trained, thus paying attention to minority class samples without causing overfitting and bias in data analysis. In addition, to account for the within-group and between-group tumor similarity, we performed 3 feature similarity tests within the same mutation groups, between different mutation groups, and between randomly selected groups.
On the other hand, we observed that image feature patterns showed no correlations with tumor size (volume) (p = 0.79) and tumor location (p = 0.42), which indicates that the extracted tumor imaging features on WBMRI are independent from the body parts and size of NF1 lesions. In addition, we demonstrated that genotype–phenotype linkage between NF1 gene mutation and tumor imaging features exists. This indicated that our results were not biased by the different number and size of lesions in each patient. Due to the small number of patients and the relatively large number of mutation types and domains, we were not able to perform the per-patient machine-learning classification test using random forest as we did in the per-tumor study. Overall, the results of both machine-learning and statistical analysis studies are supportive of the radiogenomics of NF1: neurofibromas may share underlying imaging features related to mutation domains and types regardless of their locations and sizes, as well as specific patients. This also demonstrated that our results were not biased by image artifacts or noise, size, or number of neurofibromas on WBMRI, as well as specific patients.
This preliminary study had several limitations. The first limitation was the small number of cases and the unbalanced number of mutation domains and types. For example, MD-4 was present in only a total of 17 (7.8%) lesions and nonsense types had a total of 8 (3.7%) lesions. These small numbers of lesion subtypes generated the lowest performance in classification of mutation domains and mutation types in per-tumor study. However, we observed that patients with nonsense mutation type were all located in P5 and P6 clusters in per-patient heatmap (see figure 4). This indicates that nonsense mutation type shares some common imaging features; however, due to the small number of tumors, we cannot sufficiently train the classifier to predict nonsense mutation type in per-tumor study. Further studies are needed to validate the classification performance of these low-prevalent mutation domains and mutation types. In addition, although we applied SMOTE resampling to balance the radiomics samples in statistical tests, further investigation is needed to determine whether the uneven distribution of tumors with specific gene mutations have biased the radiogenomics analysis.
Another limitation was the selection of 59 imaging features in the study. Some of these features may be interrelated, for example, tumor homogeneity may be calculated and extracted from histogram, RL matrix, or GLCM. Although this correlation among different features did not diminish the NF1 radiogenomics in this study, it may cause feature suppression in the selection of the most important imaging features for machine-learning classification. Reduction of feature redundancy will assist the identification of specific imaging phenotypes related to NF1 genotypes in our future work. In addition, signal intensity in MRI/STIR sequence may vary among different MRI vendors, which may affect the minimum/maximum thresholds and the bin size or bin numbers for calculating textures of signal intensity.
Overall, NF research has been held back by poor genotype–phenotype correlations. Despite the preliminary nature of the study, we need to emphasize that this radiogenomic study investigated the genotype–phenotype linkage between NF1 gene mutation and tumor imaging features on WBMRI, which is the commonly used imaging modality in NF1 surveillance and thus easily generalizable to many NF centers. Although the findings of this study warrant validation by larger studies, it may provide a new dimension for investigating NF1 tumor genotype–phenotype correlations focusing on prognosis and behavior of tumors, including the natural clinical history and growth behavior of NF1 tumors, and the malignant transformation of PNs by using WBMRI. Therefore, NF1 radiogenomics on WBMRI may become a promising approach for the risk stratification and management of patients with NF1.
Acknowledgment
Coinvestigator: Vanessa Merker, MS (Study Coordinator).
Glossary
- AA
aminoacid
- CSRD
cysteine/serine-rich domain
- CTD
C-terminal domain
- DN
discrete neurofibroma
- GAP
GTPase activating domain
- GLCM
gray level co-occurrence matrix
- MD
mutation domain
- MT
mutation type
- NF1
neurofibromatosis 1
- NGS
next-generation sequencing
- PH
pleckstrin homology
- PN
plexiform neurofibroma
- RL
run-length
- SBD
syndecan-binding domain
- SDF
significant different feature
- SMOTE
synthetic minority over-sampling technique
- STIR
short tau inversion recovery
- Tub
tubulin-binding domain
- WBMRI
whole-body MRI
Appendix. Authors
Study funding
This research was partly supported by grants R42CA192600, R21NS096402, and K12CA090354 from the NIH, the Department of Defense (W81XWH-16-1-0220), and Children Tumor Foundation (2015-04-002).
Disclosure
Y. Liu, J. Jordan, M. Bredella, S. Erdin, J. Walker, and M. Vangel report no disclosures relevant to the manuscript. G. Harris: medical advisory board, Fovia, Inc; stockholder: IQ Medical Imaging LLC, Precision Imaging Metrics LLC. S. Plotkin reports no disclosures relevant to the manuscript. W. Cai: stockholder: IQ Medical Imaging LLC. Go to Neurology.org/N for full disclosures.
References
- 1.Marchuk DA, Saulino AM, Tavakkol R, et al. cDNA cloning of the type 1 neurofibromatosis gene: complete sequence of the NF1 gene product. Genomics 1991;11:931–940. [DOI] [PubMed] [Google Scholar]
- 2.Human Gene Mutation Database. Available at: hgmd.cf.ac.uk/ac/gene.php?gene=NF1. Accessed November 11, 2019. [Google Scholar]
- 3.Stenson PD, Mort M, Ball EV, Shaw K, Phillips A, Cooper DN. The Human Gene Mutation Database: building a comprehensive mutation repository for clinical and molecular genetics, diagnostic testing and personalized genomic medicine. Hum Genet 2014;133:1–9. [DOI] [PMC free article] [PubMed] [Google Scholar]
- 4.Huson SM, Harper PS, Compston DA. Von Recklinghausen neurofibromatosis: a clinical and population study in south-east Wales. Brain 1988;111:1355–1381. [DOI] [PubMed] [Google Scholar]
- 5.Lammert M, Friedman JM, Kluwe L, Mautner VF. Prevalence of neurofibromatosis 1 in German children at elementary school enrollment. Arch Dermatol 2005;141:71–74. [DOI] [PubMed] [Google Scholar]
- 6.Rasmussen SA, Friedman JM. NF1 gene and neurofibromatosis 1. Am J Epidemiol 2000;151:33–40. [DOI] [PubMed] [Google Scholar]
- 7.Stumpf DA, Alksne JF, Annegers JF, et al. Neurofibromatosis: conference statement: National Institutes of Health consensus development conference. Arch Neurol 1988;45:575–578. [PubMed] [Google Scholar]
- 8.Gutmann DH, Aylsworth A, Carey JC, et al. The diagnostic evaluation and multidisciplinary management of neurofibromatosis 1 and neurofibromatosis 2. JAMA 1997;278:51–57. [PubMed] [Google Scholar]
- 9.Messiaen L, Yao S, Brems H, et al. Clinical and mutational spectrum of neurofibromatosis type 1-like syndrome. JAMA 2009;302:2111–2118. [DOI] [PubMed] [Google Scholar]
- 10.Mulvihill JJ, Parry DM, Sherman JL, Pikus A, Kaiser-Kupfer MI, Eldridge R. NIH conference: neurofibromatosis 1 (Recklinghausen disease) and neurofibromatosis 2 (bilateral acoustic neurofibromatosis): an update. Ann Intern Med 1990;113:39–52. [DOI] [PubMed] [Google Scholar]
- 11.Ruggieri M. The different forms of neurofibromatosis. Childs Nerv Sys 1999;15:295–308. [DOI] [PubMed] [Google Scholar]
- 12.Woodruff JM. Pathology of tumors of the peripheral nerve sheath in type 1 neurofibromatosis. Am J Med Genet 1999;89:23–30. [DOI] [PubMed] [Google Scholar]
- 13.Ahlawat S, Fayad LM, Khan MS, et al. Current whole-body MRI applications in the neurofibromatoses: NF1, NF2, and schwannomatosis. Neurology 2016;87:S31–S39. [DOI] [PMC free article] [PubMed] [Google Scholar]
- 14.Plotkin SR, Bredella MA, Cai W, et al. Quantitative assessment of whole-body tumor burden in adult patients with neurofibromatosis. PLoS One 2012;7:e35711. [DOI] [PMC free article] [PubMed] [Google Scholar]
- 15.Cai W, Kassarjian A, Bredella MA, et al. Tumor burden in patients with neurofibromatosis types 1 and 2 and schwannomatosis: determination on whole-body MR images. Radiology 2009;250:665–673. [DOI] [PubMed] [Google Scholar]
- 16.Dombi E, Solomon J, Gillespie AJ, et al. NF1 plexiform neurofibroma growth rate by volumetric MRI: relationship to age and body weight. Neurology 2007;68:643–647. [DOI] [PubMed] [Google Scholar]
- 17.Nguyen R, Jett K, Harris GJ, Cai W, Friedman JM, Mautner VF. Benign whole body tumor volume is a risk factor for malignant peripheral nerve sheath tumors in neurofibromatosis type 1. J Neurooncol 2014;116:307–313. [DOI] [PubMed] [Google Scholar]
- 18.Aerts HJ, Velazquez ER, Leijenaar RT, et al. Decoding tumour phenotype by noninvasive imaging using a quantitative radiomics approach. Nat Commun 2014;5:4006. [DOI] [PMC free article] [PubMed] [Google Scholar]
- 19.Lambin P, Rios-Velazquez E, Leijenaar R, et al. Radiomics: extracting more information from medical images using advanced feature analysis. Eur J Cancer 2012;48:441–446. [DOI] [PMC free article] [PubMed] [Google Scholar]
- 20.Diehn M, Nardini C, Wang DS, et al. Identification of noninvasive imaging surrogates for brain tumor gene-expression modules. Proc Natl Acad Sci USA 2008;105:5213–5218. [DOI] [PMC free article] [PubMed] [Google Scholar]
- 21.Segal E, Sirlin CB, Ooi C, et al. Decoding global gene expression programs in liver cancer by noninvasive imaging. Nat Biotechnol 2007;25:675–680. [DOI] [PubMed] [Google Scholar]
- 22.Kumar V, Gu Y, Basu S, et al. Radiomics: the process and the challenges. Magn Reson Imaging 2012;30:1234–1248. [DOI] [PMC free article] [PubMed] [Google Scholar]
- 23.Huang Y, Liu Z, He L, et al. Radiomics signature: a potential biomarker for the prediction of disease-free survival in early-stage (I or II) non-small cell lung cancer. Radiology 2016;281:947–957. [DOI] [PubMed] [Google Scholar]
- 24.Smits M, van den Bent MJ. Imaging correlates of adult glioma genotypes. Radiology 2017;284:316–331. [DOI] [PubMed] [Google Scholar]
- 25.Grimm LJ. Breast MRI radiogenomics: current status and research implications. J Magn Reson Imaging 2016;43:1269–1278. [DOI] [PubMed] [Google Scholar]
- 26.Li H, Durbin R. Fast and accurate short read alignment with Burrows-Wheeler transform. Bioinformatics 2009;25:1754–1760. [DOI] [PMC free article] [PubMed] [Google Scholar]
- 27.McKenna A, Hanna M, Banks E, et al. The Genome Analysis Toolkit: a MapReduce framework for analyzing next-generation DNA sequencing data. Genome Res 2010;20:1297–1303. [DOI] [PMC free article] [PubMed] [Google Scholar]
- 28.Wang K,Li M, Hakonarson H. ANNOVAR: functional annotation of genetic variants from high-throughput sequencing data. Nucleic Acids Res 2010;38:e164. [DOI] [PMC free article] [PubMed] [Google Scholar]
- 29.Messiaen L, Wimmer K. NF1 mutational spectrum. In: Kaufmann D, ed. Neurofibromatoses: Monographs in Human Genetics. Basel: Karger; 2008:63–77. [Google Scholar]
- 30.Sonka M, Hlavac V, Boyle R. Image Processing, Analysis, and Machine Vision, 3rd ed. New York: CL Engineering; 2008. [Google Scholar]
- 31.Haralick RM, Shanmugam K, Dinstein I. Textural features for image classification. IEEE Trans Syst Man Cybern 1973;3:610–621. [Google Scholar]
- 32.O'Sullivan F, Roy S, O'Sullivan J, Vernon C,Eary J. Incorporation of tumor shape into an assessment of spatial heterogeneity for human sarcomas imaged with FDG-PET. Biostatistics 2005;6:293–301. [DOI] [PubMed] [Google Scholar]
- 33.Jain AK. Fundamentals of Digital Image Processing. Upper Saddle River: Prentice Hall; 1989. [Google Scholar]
- 34.Sadjadi FA, Hall EL. Three-dimensional moment invariants: pattern analysis and machine intelligence. IEEE Trans PAMI 1980;2:127–136. [DOI] [PubMed] [Google Scholar]
- 35.Eisen MB, Spellman PT, Brown PO, Botstein D. Cluster analysis and display of genome-wide expression patterns. Proc Natl Acad Sci USA 1998;95:14863–14868. [DOI] [PMC free article] [PubMed] [Google Scholar]
- 36.Bergkvist A, Rusnakova V, Sindelka R, et al. Gene expression profiling: clusters of possibilities. Methods 2010;50:323–335. [DOI] [PubMed] [Google Scholar]
- 37.Grant GR, Manduchi E, Stoeckert CJ Jr. Analysis and management of microarray gene expression data. Curr Protoc Mol Biol 2007;19:6. [DOI] [PubMed] [Google Scholar]
- 38.Gu Z, Eils R, Schlesner M. Complex heatmaps reveal patterns and correlations in multidimensional genomic data. Bioinformatics 2016;32:2847–2849. [DOI] [PubMed] [Google Scholar]
- 39.Maimon O, Rokach L. Data Mining and Knowledge Discovery Handbook, 2nd ed. Berlin: Springer; 2010. [Google Scholar]
- 40.Chawla NV, Bowyer KW, Hall LO, Kegelmeyer WP. SMOTE: synthetic minority over-sampling technique. J Artif Intell Res 2002;16:321–357. [Google Scholar]
- 41.R Core Team. R: A Language and Environment for Statistical Computing. Vienna: R Foundation for Statistical Computing; 2013. [Google Scholar]
- 42.Jackson A, O'Connor JP, Parker GJ, Jayson GC. Imaging tumor vascular heterogeneity and angiogenesis using dynamic contrast-enhanced magnetic resonance imaging. Clin Cancer Res 2007;13:3449–3459. [DOI] [PubMed] [Google Scholar]
- 43.Karlo CA, Di Paolo PL, Chaim J, et al. Radiogenomics of clear cell renal cell carcinoma: associations between CT imaging features and mutations. Radiology 2014;270:464–471. [DOI] [PMC free article] [PubMed] [Google Scholar]
- 44.Jamshidi N, Jonasch E, Zapala M, et al. The radiogenomic risk score: construction of a prognostic quantitative, noninvasive image-based molecular assay for renal cell carcinoma. Radiology 2015;277:114–123. [DOI] [PubMed] [Google Scholar]
- 45.Ponti G,Martorana D, Pellacani G, et al. NF1 truncating mutations associated to aggressive clinical phenotype with elephantiasis neuromatosa and solid malignancies. Anticancer Res 2014. 34:3021–3030. [PubMed] [Google Scholar]
- 46.Kobus K, Hartl D, Ott CE, et al. Double NF1 inactivation affects adrenocortical function in NF1Prx1 mice and a human patient. PLoS One 2015;10:e0119030. [DOI] [PMC free article] [PubMed] [Google Scholar]
Associated Data
This section collects any data citations, data availability statements, or supplementary materials included in this article.
Data Availability Statement
Anonymized data will be shared by request from any qualified investigator: (1) gene sequencing results of 29 patients; (2) the tumor type and location of 218 neurofibromas identified on WBMRI in 19 of the 29 patients; (3) the NF1 gene mutation and tumor numbers in 19 of the 29 patients with at least 1 neurofibroma identified on WBMRI (doi.org/10.5061/dryad.bd87805).


