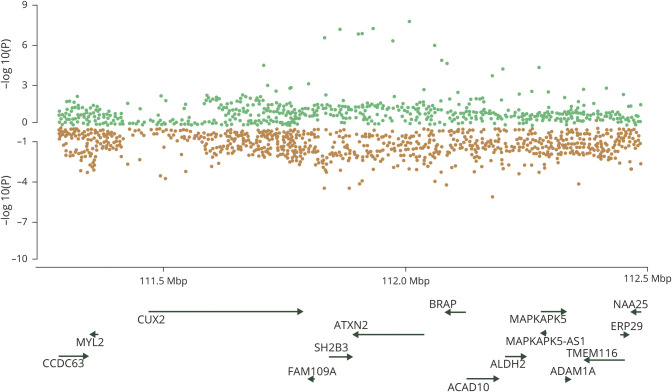
Figure 1. Miami plots of the 12q24.12 region highlighted by gwas-pw analysis.
Publicly available single nucleotide polymorphism association p values for each trait of the pair are plotted. Genes that mapped under the locus at 12q24.12 highlighted in the analysis between estimated glomerular filtration rate (green) and large artery stroke (orange).

