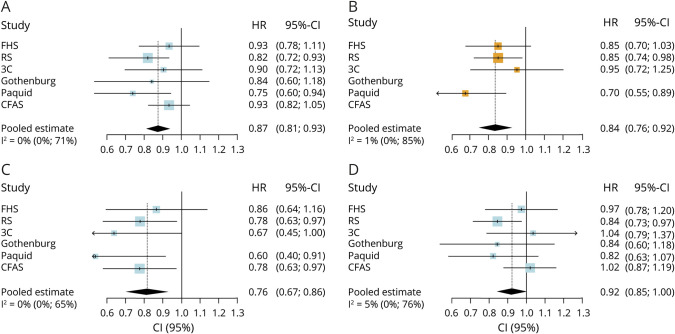
Figure 3. Trends in the incidence of dementia.
The forest plots represent the incidence trend for (A) all-cause dementia, (B) Alzheimer disease, (C) all-cause dementia in men, and (D) all-cause dementia in women, expressed as a hazard ratio (HR) per 10-year advance in calendar time. This HR was calculated to compare temporal trends across studies, and can be interpreted as a change in the 5-year hazard per decade advance in calendar time. 3C = Three-City Study; CFAS = Cognitive Function and Ageing Studies; CI = confidence interval; FHS = Framingham Heart Study; RS = Rotterdam Study.

