Abstract
Objective
To investigate the association between β-amyloid (Aβ) load and postmortem structural network topology in decedents without dementia.
Methods
Fourteen decedents (mean age at death 72.6 ± 7.2 years) without known clinical diagnosis of neurodegenerative disease and meeting pathology criteria only for no or low Alzheimer disease (AD) pathologic change were selected from the Normal Aging Brain Collection Amsterdam database. In situ brain MRI included 3D T1-weighted images for anatomical registration and diffusion tensor imaging for probabilistic tractography with subsequent structural network construction. Network topologic measures of centrality (degree), integration (global efficiency), and segregation (clustering and local efficiency) were calculated. Tissue sections from 12 cortical regions were sampled and immunostained for Aβ and hyperphosphorylated tau (p-tau), and histopathologic burden was determined. Linear mixed effect models were used to assess the relationship between Aβ and p-tau load and network topologic measures.
Results
Aβ was present in 79% of cases and predominantly consisted of diffuse plaques; p-tau was sparsely present. Linear mixed effect models showed independent negative associations between Aβ load and global efficiency (β = −0.83 × 10⁻³, p = 0.014), degree (β = −0.47, p = 0.034), and clustering (β = −0.55 × 10⁻², p = 0.043). A positive association was present between Aβ load and local efficiency (β = 3.16 × 10⁻³, p = 0.035). Regionally, these results were significant in the posterior cingulate cortex (PCC) for degree (β = −2.22, p < 0.001) and local efficiency (β = 1.01 × 10⁻², p = 0.014) and precuneus for clustering (β = −0.91 × 10⁻², p = 0.017). There was no relationship between p-tau and network topology.
Conclusion
This study in deceased adults with AD-related pathologic change provides evidence for a relationship among early Aβ accumulation, predominantly of the diffuse type, and structural network topology, specifically of the PCC and precuneus.
With increasing age, cognitively healthy people may show substantial β-amyloid (Aβ) and hyperphosphorylated tau (p-tau) protein accumulation and deposits.1 This process can be seen as pathologic change in normal aging, or in the evolution of Alzheimer disease (AD).2,3 As such, the cascade of biological processes underlying AD can occur decades before the onset of AD-related symptoms.1,4 Capturing age and AD-related pathologic change prior to onset of noticeable symptoms can be promising for early identification of individuals at risk for developing AD.5
The characteristic spatial pattern of Aβ distribution as described by Braak and Braak6 suggests that Aβ spreads from regions exhibiting Aβ to interconnected neuronal regions though large-scale cellular networks.7 Advances in MRI analysis and graph theory have made it possible to study this brain network organization,8 which have been extensively applied in studies on aging and AD-related cognitive decline.9,10 Research on the association between early Aβ accumulation and brain network topology have used proxies for Aβ accumulation, such as CSF11 or Aβ PET.12 However, CSF is a nonregional specific marker of pathologic state, and Aβ PET primarily binds to fibrillar dense-core Aβ aggregates rather than non-neuritic diffuse plaques, which are generally seen in early stages of Aβ accumulation.13,14
Our aim was to investigate the radiologic–pathologic association between pathologically defined early-stage Aβ and p-tau load and structural network topologic measures of centrality, integration, and segregation in non-neurologic brain donors, using a unique within-subject postmortem MRI and histopathology approach.
Methods
Standard protocol approvals, registrations, and patient consents
Prior to death, all donors were registered with the body bequest program at the Department of Anatomy and Neurosciences, Amsterdam UMC–location VUmc, Amsterdam, the Netherlands. All donors gave written informed consent for the use of their tissue and medical records for research purposes. MRI, autopsy, radiologic (F.B.), and neuropathologic (A.J.M.R.) assessment were done through the Normal Aging Brain Collection Amsterdam (NABCA) pipeline (nabca.eu).15 Permission for performing MRI, autopsies, and use of tissue was granted by the institutional ethics review board.
Donor inclusion
From the NABCA biobank, donors were selected based on the following inclusion and exclusion criteria. (1) No clinical diagnosis of neurodegenerative disease in their medical history. (2) Availability of in situ MRI without signs of overt neurodegenerative or major vascular disease. (3) Availability of a neuropathologic diagnosis,15 and if present, with pathology meeting criteria for no or low AD pathologic change according to the National Institute of Aging–Alzheimer's Association (NIA-AA) guidelines,16,17 and without other neurologic disease.
Data availability
Data are available upon reasonable request through NABCA (nabca.eu).15
In situ MRI acquisition and volume measurements
In situ (brain still in cranium) imaging data were collected with a 3T whole-body MRI system (Signa, MR750; GE Medical Systems, Milwaukee, WI) using an 8-channel head coil. Structural imaging involved the use of a sagittal 3D T1-weighted fast spoiled gradient-echo sequence (repetition time [TR], 7 ms; echo time [TE], 3 ms; inversion time [TI], 450 ms; 15° flip angle; slice thickness 1.0 mm; in-plane resolution 1.0 × 1.0 mm2) for cortical gray matter (GM) segmentation, and a 3D fluid-attenuated inversion recovery image (FLAIR; TR, 8,000 ms; TE, 130 ms; TI, 2,000–2,250 ms [optimized per case to account for temperature differences leading to variable CSF suppression], sagittal slice thickness 1.2 mm; in‐plane resolution 1.11 × 1.11 mm2) for detection of white matter (WM) abnormalities. In addition, 2D echoplanar diffusion tensor imaging (DTI) was performed (TR, 7,400 ms; TE, 92 ms; slice thickness 2 mm; in-plane resolution 2.0 × 2.0 mm2), using a twice refocused SE diffusion technique with 30 noncollinear gradient-encoding directions with b values = 700 seconds/mm2 and 5 nonweighted volumes. From 3D T1 images, normalized whole brain, WM, and GM volume was estimated using SIENAX (part of FSL 5.0.9; fsl.fmrib.ox.ac.uk/)18 and normalized hippocampal volume using FIRST (part of FSL) after lesion filling.
Construction of structural connectomes
WM abnormalities were segmented on FLAIR images using multiview convolutional neural network with batch normalization followed by manual editing, yielding lesion maps, which were registered to the 3D T1 images. Lesion refilling was performed using LEAP19 to minimize the impact of lesions on subsequent automated segmentations. The transformation between 3DT1 and diffusion-weighted images was derived by using boundary-based registration.20 The diffusion-weighted images were corrected for motion and eddy current distortion using FMRIB's Diffusion Toolbox (FSL-FDT; part of FSL 5.0.9). A surface based version of the automated anatomical labeling atlas was used to parcellate the cortex into 78 areas21 and FIRST (part of FSL) was used to delineate deep GM, constituting a total 92 nodes. Subsequently, bedpostx was run to build up diffusion parameter distributions at each voxel, after which probabilistic tractography was conducted (probtrackx2, part of FSL, 5,000 streamlines per voxel) to obtain probabilistic maps of WM connections running between all pairs of nodes, resulting in a nonweighted 92 × 92 structural network for each participant. The tractography was corrected for seed volume, target volume, and (multiplied by) length of tracts.22
Computation of graph theory measures
The resulting connectivity matrixes were analyzed in MATLAB (MATLAB R2012a, The MathWorks Inc., Natick, MA, 2000). The matrix was symmetrized by computing the average between the original matrix and its transpose. The edges were thresholded (range 5%–45%, increments of 5%) to reduce the number of false-positive connections; the top 20% strongest links were retained, which approximates the most optimal balance in cost vs efficiency of the brain.23 Subsequently the edges were binarized. Similarity between the topographic location of the edges between cases was determined using the Dice24 similarity coefficient. The average (±SD) Dice similarity coefficient was 0.82 (±0.02), indicating good correspondence between participants in terms of the location of connections. From the binarized matrix, graph theoretical characteristics were computed using the Brain Connectivity Toolbox as described previously.25 In the current study, we included network degree as a measure of centrality,25 global efficiency as a measure of integration, and local efficiency as a measure of segregation26 (figure 1).
Figure 1. Visual representation of graph measures.
(A) Degree: higher degree regions (e.g., filled in orange) have more connections.25 (B) Global efficiency provides a measure for how easily information can be transmitted from one side of the network to the other (dark line), taking the inverse of the average path length between nodes. Local efficiency (top left in green) is defined as the inverse of the shortest path length between connected nodes that are neighbors with the node of interest. The shortest path is defined as number of steps, or links, between network nodes.26 (C) Clustering coefficient is defined as the fraction of triangles around a node (green node) and represents the degree to which neighbors of a node tend to also be connected.25
Network degree of a brain region (node) is defined by the number of connections (edges) that link the region to other brain regions (nodes). A high degree means that a region is highly connected to other regions.25
Global efficiency is the average inverse number of edges that need to be traveled to go from one node to the other in the network (inverse of the average path length).
Local efficiency is defined as the inverse of the shortest path length (number of steps, or links, between network nodes) between connected nodes that are neighbors with the node of interest.
Clustering is defined as the fraction of triangles around a node and represents the degree to which neighbors of a node tend to also be connected.
To indicate regions as “hubs” (the regions with the top 10% highest connections), for each region within a participant network degree and betweenness centrality (the fraction of all shortest paths in the network that contain a given node)25 were calculated. Subsequently, median network degree and median betweenness centrality were calculated for a region across all participants. Finally, these 2 measures were independently inverse ranked and summed. The highest rank scores indicated hub regions.
Tissue sampling of cortical regions
After in situ MRI, the donor was transported to the mortuary for subsequent rapid autopsy of the brain. From the right hemisphere, tissue blocks were dissected according to a strict anatomical protocol15 to ensure consensus in regions across participants. For the current study, tissue blocks from 12 standardized cortical brain regions were collected: the precuneus, posterior cingulum, frontal pole, middle frontal cortex, inferior parietal cortex, temporal pole, superior frontal cortex, insula cortex, anterior cingulate cortex, middle temporal cortex, and occipital cortex. In addition, the middle hippocampus with the entorhinal cortex was dissected.
Immunostaining for Aβ and p-tau
Serial sections of paraffin-embedded tissue blocks were cut at 20 μm (Leica [Newcastle, UK] Microtome) and mounted onto glass slides. A Nissl staining (for anatomical orientation) and Aβ immunohistochemistry was performed on all 12 cortical regions. For measuring p-tau pathology, sections were cut at 6 μm of 8 cortical regions (precuneus, anterior and posterior cingulate, superior and middle frontal cortex, inferior parietal cortex, middle temporal cortex, and entorhinal cortex).
Sections were deparaffinized and rehydrated in a graded series of xylene and ethanol before following a standard Nissl protocol. The sections for the Aβ immunostaining were deparaffinized and rehydrated, after which they were washed in Tris-buffered saline (TBS) followed by antigen retrieval in citrate buffer (pH 6.0) at a temperature of 95° for 30 minutes. After cooling down for approximately 45 minutes, they were again washed in TBS followed by an 80% formic acid block for 5 minutes. The sections were subsequently rinsed for 10 minutes in running demi water and a 5-minute wash in TBS. This was followed by preventing background noise by bleaching for the endogenous peroxidase for 20 minutes (0.3% H2O2 in 50% ethanol) and another 3 × 5 minutes wash with TBS. Finally, the sections were incubated with a primary mouse anti-Aβ antibody (6F/3D, 1:1,000; Dako, Glostrup, Denmark) in a blocking solution (2% bovine serum albumin in TBS-Tx) for approximately 24 hours at 4°.
The second day commenced with a 3 × 5 minutes wash in TBS, followed by a 1-hour incubation at room temperature with Envision (horseradish peroxidase mouse). This was followed by a 2 × 5 minutes TBS wash and a 5-minute Tris-HCl wash, after which the peroxidase reaction was developed with 3,3′-diaminobenzidine tetrahydrochloride dehydrate (DAB; Dako) as a chromogen. The sections were subsequently washed in Tris-HCl and running demi water, followed by a hematoxylin counterstain for 1 minute, which was developed by running tap water for 5 minutes. Finally, the sections were dehydrated and cleared in a graded series of ethanol and xylene, and closed with entellan and a coverslip.
The 6-μm sections were automatically immunostained with Ventana Benchmark Ultra (Roche Diagnostics, Mannheim, Germany) using standard CC1 pretreatment and incubation with prediluted primary antibodies against p-tau (AT8; 1:10.000, Innogenetics, Alpharetta, GA).
Semiquantitative and quantitative scoring of Aβ
A semiquantitative analysis of Aβ was manually performed on a light microscope (Leica). Each section was placed under the microscope at 200× magnification for an in-depth assessment of the types of plaques present across the section, including diffuse, classic, subpial, and perivascular Aβ depositions.27 These were scored on a 4-point scale (0 = none; 1 = sparse [1 or 2 depositions]; 2 = [more than 2 depositions or in multiple places]; 3 = frequent [multiple larger depositions in different areas, covering (almost) all of the cortical area]).
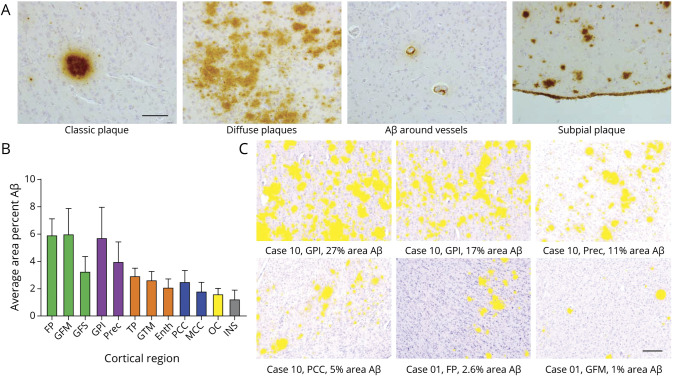
The quantitative analysis was performed using a brightfield microscope (Leica, DM5000B; Leica Microsystems, Wetzlar, Germany) with a Nuance camera (Nuance 3.02; Perkin Elmer Inc., Hopkinton, MA). With a 100× magnification, cortical areas that contained all 6 layers within the field of view were photographed in a systematic manner as “cubes.” Each section contained a minimum of 3 and maximum of 10 cubes. Parts of WM and blood vessels within a cube were manually excluded. The load of Aβ pathology was subsequently quantified as the percentage area of Aβ deposits within the image cubes with the multispectral imaging system. The specific spectra of DAB and hematoxylin were used to unmix the image cubes, and the Nuance software colocalization tool was used to calculate the percentage Aβ deposits in each cube (figure 2). For each cortical region, an average percentage Aβ was calculated across cubes. The final dataset consisted of 145 analyzed tissue sections.
Figure 2. Morphology and distribution of β-amyloid (Aβ) pathology.
(A) Morphology of Aβ depositions. From left to right: classic plaque, diffuse plaques, Aβ around vessels, and subpial plaque depositions. Scale bar = 100 μm. (B) Distribution of Aβ pathology (mean and SEM). Across cortical regions in all cases, there was more average area percent Aβ accumulation in the frontal cortex (in green) and parietal cortex (in purple) than in the temporal cortex (in orange), cingulate cortex (in blue), occipital cortex (OC; in yellow), and insular cortex (INS; in gray). (C) Indications of area percentage Aβ (in yellow) in cubes as measured with the Nuance spectral imager. Scale bar = 200 μm. Enth = entorhinal cortex; FP = frontal pole; GFM = middle frontal gyrus; GFS = superior frontal gyrus; GPI = inferior parietal gyrus; GTM = middle temporal gyrus; MCC = middle cingulate cortex; PCC = posterior cingulate cortex; Prec = precuneus; TP = temporal pole.
Semiquantitative scoring of p-tau
For the analysis of p-tau load, percentage area would not be a suitable method in this cohort, as AT8 immunoreactivity is sparse and values would be small. Therefore we adapted a semiquantitative method, which was performed manually on a light microscope (Leica). Each section was placed under the microscope at 100× and 200× magnification for an in-depth assessment of presence of p-tau immunoreactivity. Presence of p-tau included any AT8 immunoreactivity such as threads (pre-)tangles, dystrophic neurites, or thorny or fuzzy astrocytes in all layers of the cortex. This was subsequently scored on a 4-point scale, adapted from a scoring method by Alafuzoff and et al.28 Scoring consisted of 0 = absent AT8 immunoreactivity; 1 = very sparse AT8 immunoreactivity (<∼5 observations throughout the section, only visible with 200× magnification), which is less than the “low +” scoring by Alafuzoff et al.28; 2 = sparse AT8 immunoreactivity (barely noted at 100× magnification), similar to the “low +” scoring by Alafuzoff et al.28; 3 = moderate AT8 immunoreactivity (easily seen at both magnifications); and 4 = high AT8 immunoreactivity (seen even without the microscope), similar to the “moderate ++” and “high +++” scoring method of Alafuzoff et al.28
Statistical analysis
Descriptive and statistical analysis was performed using IBM SPSS 22.0 for Windows (SPSS, Inc., Chicago, IL). With a bivariate correlation, the relationship between Aβ load and age was assessed, with a Kruskal-Wallis test assessing the relationship between Aβ load and genotype. To account for multiple (i.e., 12) brain regions within cases (i.e., non-independent, nested data), the relationship between network measures and percent Aβ load or p-tau was assessed with (multiple) linear mixed models. The graph theoretical measures were the dependent variables, percent Aβ load or p-tau the main effect factors, with age, sex, and postmortem delay as covariates. The intercept was included as random effect. p Values < 0.05 were considered significant. For the independent regional analyses (i.e., the 12 regions with tissue sections), the Benjamini and Hochberg false discovery rate (FDR) correction for multiple comparisons was applied.29
Results
Donor characteristics
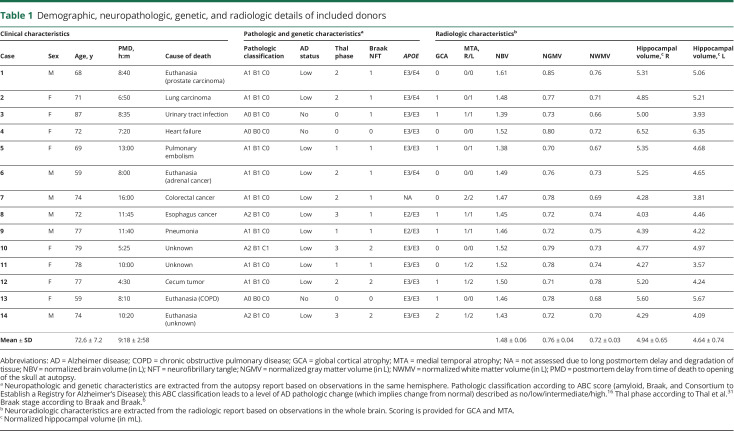
Brain sections from 14 donors (8 female/6 male) with an average age of 73 years (range 59–87) were included in the study. Mean (±SD) postmortem delay was 9 hours 18 minutes (±3 hours). Most participants had atrophy scores as expected for their age (for example, medial temporal atrophy scores >2 for adults over 75 years of age).30 Eleven decedents showed Aβ pathology, but this did not exceed Thal phase 3 (e.g., depositions in striatum or thalamus, but not brainstem regions).31 Eleven decedents showed p-tau pathology, but this did not exceed Braak neurofibrillary tangle (NFT) stage 2 (NFTs not beyond the entorhinal cortex).6 Table 1 provides demographic, neuropathologic, and radiologic details of the donors. There was no relationship between percent Aβ load and age, or Aβ load and APOE genotype.
Table 1.
Demographic, neuropathologic, genetic, and radiologic details of included donors
Aβ and p-tau morphology and load
Ten decedents showed Aβ depositions in the selected cortical regions. When Aβ depositions were present, they predominantly consisted of diffuse plaques (median 2; range 1–3). A few subpial depositions, classic plaques, and perivascular Aβ depositions were also observed (all median 0; range 0–3 for subpial and perivascular Aβ depositions and range 0–2 for classic plaque depositions). Regarding variation of plaque types, 96 (of 145 included) tissue sections showed some Aβ pathology; 32 tissue sections had only 1 type of plaque present (diffuse plaques), 19 tissue sections had 2 types of plaques (13 diffuse and subpial, 3 diffuse and classical, 3 diffuse and perivascular depositions), 37 sections had 3 types of plaques (28 diffuse, subpial, and classic, 7 diffuse, subpial, and perivascular depositions, and 2 diffuse, classic, and perivascular depositions), and 8 sections had all 4 types of plaques present across 6 different regions (anterior cingulate, middle frontal cortex, temporal pole, entorhinal cortex, inferior parietal lobe, and occipital lobe).
In cases with amyloid depositions, distribution of Aβ pathology average area percent Aβ load (±SEM) was more abundant in frontal (5.09 ± 1.35) and parietal (4.87 ± 1.82) regions than in the temporal (2.58 ± 0.58), cingulate (2.19 ± 0.79), occipital (1.63 ± 0.39), and insula (1.26 ± 0.65) regions (see figure 2).
Twelve cases showed sparse p-tau positivity. Cortical regions that contained AT8 immunoreactivity were the entorhinal cortex, middle temporal cortex, superior and middle frontal cortex, precuneus, inferior parietal cortex, and anterior and posterior cingulate cortex. Fifty-seven (of 95 included) tissue sections showed some AT8 immunoreactivity: 50 sections “very sparse” reactivity, 5 sections “sparse” reactivity (case 10 anterior and posterior cingulate cortex and temporal cortex; cases 11 and 12 entorhinal cortex), and 2 sections “moderate” reactivity (case 10 and 14 entorhinal cortex).
Relationship between Aβ load and global and regional volume
When assessing the association between average percent Aβ load across all included regions and independent measures of normalized global brain volume, normalized GM volume, and normalized WM volume, there was no association between Aβ load and these volume measures. In addition, there was no association between Aβ load and volume of the left and right hippocampus.
Tractography: identification of hub regions
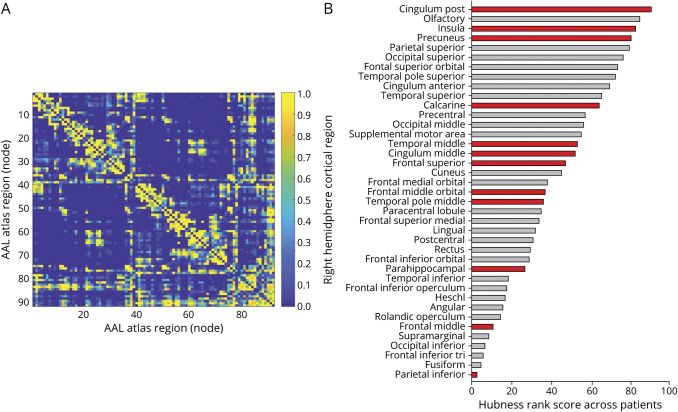
The 10% highest ranked degree and betweenness centrality regions, also referred to as hubs, were the (left and right) putamen, (left and right) thalamus, (left and right) posterior cingulate cortex, (right and left) pallidum, and right olfactory cortex, respectively. When only considering cortical regions, the (left and right) posterior cingulate cortex, (left and right) precuneus, (left and right) olfactory cortex, right insular cortex, and right superior parietal cortex were hub regions, which overlap to what has been found in the in vivo literature.32,33
For our analysis, 12 right hemispheric cortical regions were selected, and presence of both high and low hub regions were confirmed; the posterior cingulate, insula, and precuneus had the highest hubness and the middle frontal cortex and inferior parietal cortex the lowest hubness (figure 3).
Figure 3. Average structural connectivity matrix and distribution of hubness across cortical regions of the right hemisphere.
(A) The structural connectivity matrix was computed on a whole-brain (92 nodes) level. Shown here is the average binary matrix across 14 subjects. (B) Hub rank (based on network degree and betweenness centrality) of the right hemisphere across 14 subjects, partitioned according to the automated anatomical labeling (AAL) atlas. Highest summed rank regions (top) to lowest summed rank regions (bottom). Highlighted in red are the tissue regions included in our model assessing association between β-amyloid load and structural network topology.
Relationship between Aβ load and network topology
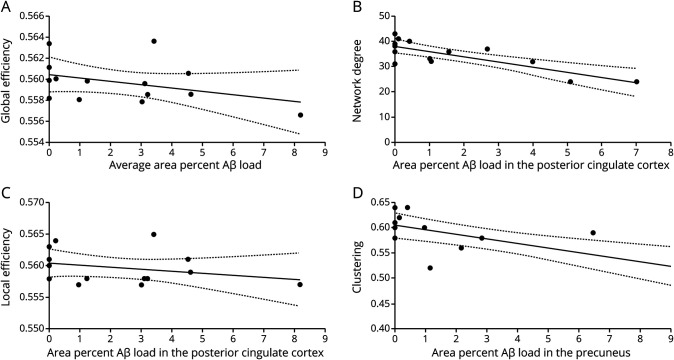
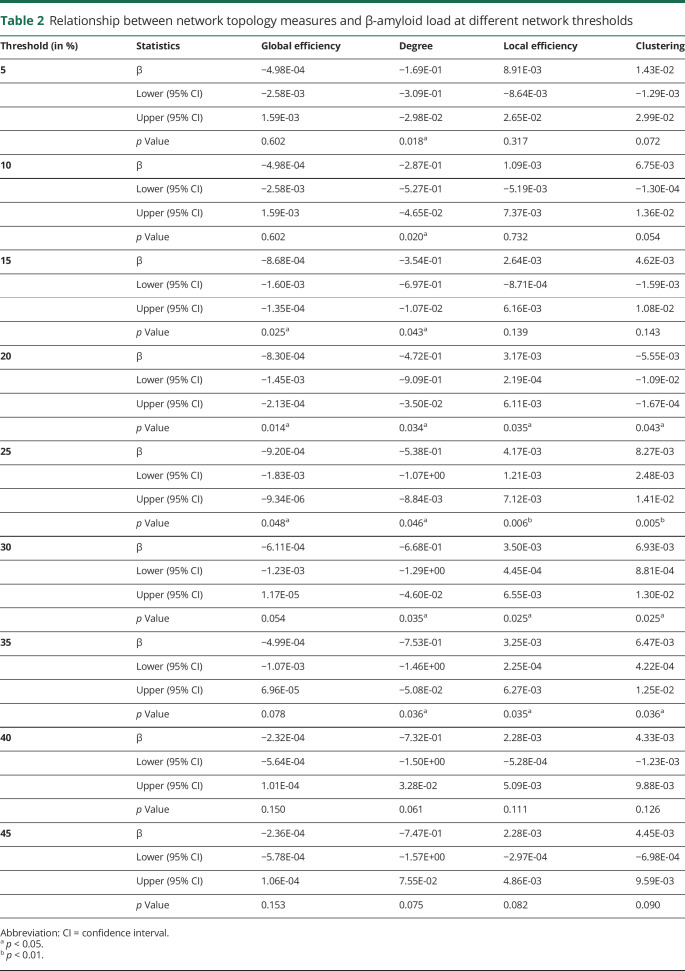
On a global, whole brain level (n = 14 cases), an association between average percent Aβ load and global efficiency was found (β = −0.83 × 10⁻³ [95% confidence interval (CI) −1.4 × 10⁻³, −0.2 × 10⁻³]; p = 0.014) (figure 4A), indicating that higher Aβ load is related to lower global efficiency. This result remained significant at thresholds 15%–25% (table 2). On a local level (n = 145 sections across 12 regions), a significant association between percent Aβ load and degree (β = −0.47 [95% CI −0.91, −0.03]; p = 0.034), clustering (β = −0.55 × 10⁻² [95% CI −0.1, −0.1 × 10⁻²]; p = 0.043), and local efficiency (β = 3.16 × 10⁻³ [95% CI 0.2 × 10⁻³, 6.1 × 10⁻³]; p = 0.035) was found. This indicates that higher Aβ load is related to lower degree and higher local efficiency. These results did not change when controlling for presence of p-tau. The network topology measures appear robust at thresholds ranging from 5% to 35% for degree and 20%–35% for local efficiency and clustering (table 2).
Figure 4. Relationship between network topology and area percent β-amyloid (Aβ) load.
(A) Relationship between global efficiency and average Aβ load of a subject, corrected for postmortem delay (R2 = 0.15) (dotted line, 95% confidence interval [CI]). (B) A higher percent Aβ load is related to lower degree in the posterior cingulate cortex (R2 = 0.63) (dotted line, 95% CI). (C) A higher percent Aβ load is related to a higher local efficiency in the posterior cingulate cortex (R2 = 0.41) (dotted line, 95% CI). (D) A higher percent Aβ load is related to a lower clustering in the precuneus (R2 = 0.57) (dotted line, 95% CI).
Table 2.
Relationship between network topology measures and β-amyloid load at different network thresholds
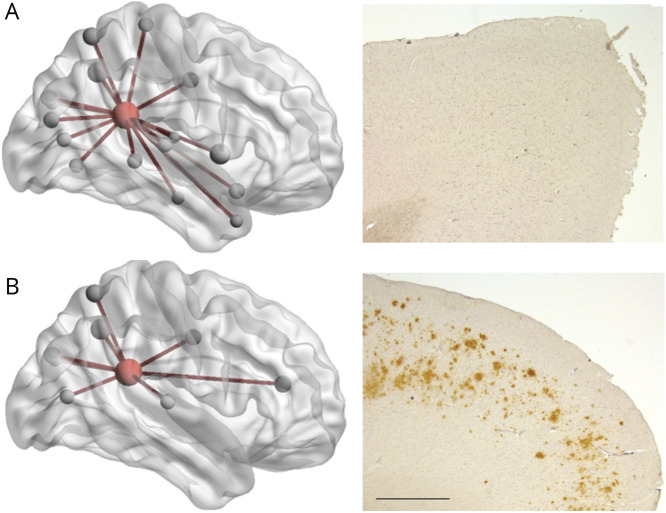
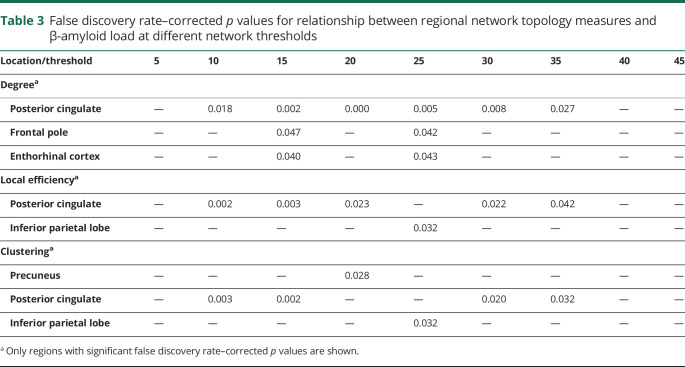
When exploring regional network topology within each of the 12 cortical regions for degree, local efficiency, and clustering, significant associations between regional area percent Aβ load and degree were found in the posterior cingulate (β = −2.22 [95% CI −3.08, −1.35]; FDR p = 0.002) and frontal pole (β = 0.73 [95% CI 0.01, 1.45]; FDR p = 0.08), the latter one not surviving FDR correction for multiple comparisons. This indicates that a higher percent Aβ load is related to a lower degree of the posterior cingulate (figures 4B and 5). In addition, a significant association between regional Aβ load and local efficiency was found for the posterior cingulate (β = 1.01 × 10⁻² [95% CI 0.26 × 10⁻², 1.76 × 10⁻²]; FDR p = 0.02) (figure 4C), meaning more Aβ load is related to a higher local efficiency in the posterior cingulate. A significant association between regional Aβ load and clustering was found for the precuneus (β = −0.91 × 10⁻² [95% CI −1.61 × 10⁻², −0.21 × 10⁻²]; FDR p = 0.028) and posterior cingulate (β = −3.03 × 10⁻² [95% CI −6.22 × 10⁻², 0.15 × 10⁻²]; FDR p = 0.1), the latter one not surviving FDR correction. This indicates that a higher percent Aβ load is related to a lower clustering in the precuneus (figure 4D). These results seem robust for degree of the posterior cingulate at thresholds ranging from 10% to 35% (table 3); for local efficiency and clustering, the results appear less robust at different thresholds.
Figure 5. Two non-neurologic cases with differential pathologic burden and network topology.
(A) A 77-year-old man without β-amyloid (Aβ) pathologic burden in the posterior cingulate cortex (PCC) of the right hemisphere (case 9 from table 1). (B) A 68-year-old woman with 7% Aβ pathologic burden in the PCC (case 1 from table 1) of the right hemisphere. Presence of Aβ load in the PCC is related to fewer connections between the PCC (in red) and cortical (gray) areas. Scale bar: 1 mm.
Table 3.
False discovery rate–corrected p values for relationship between regional network topology measures and β-amyloid load at different network thresholds
When only taking into account sections that contained Aβ load (i.e., excluding sections without pathology), association with global efficiency (n = 10 cases; p = 0.066) and network degree (n = 96 tissue sections; p = 0.062) were no longer significant. A significant association between Aβ load and clustering (β = −0.62 × 10⁻² [95% CI −1.22 × 10⁻², −0.01 × 10⁻²]; p = 0.045) and local efficiency (β = 3.54 × 10⁻³ [95% CI 0.31 × 10⁻³, 6.78 × 10⁻³]; p = 0.032) was still observed. Regionally, the association between Aβ load and clustering and local efficiency was no longer significant (respectively p = 0.143 and p = 0.054), while the association between Aβ load and network degree remained significant (β = −2.36 [95% CI −3.68, −1.03]; FDR p = 0.01).
Relationship between p-tau load and network topology
On a global, whole brain level (n = 14), no association between presence of p-tau immunoreactivity and global efficiency was found. On a local level (n = 95 sections across 8 regions), no significant association between the semiquantitative scoring of p-tau and degree or local efficiency was found. These results showed no change at different thresholds (5%–45%). When exploring regional network topology within each of the 8 cortical regions for degree, local efficiency, and clustering, only a trend associations between p-tau and clustering was found for the anterior cingulate cortex (p = 0.052; not FDR corrected).
Discussion
In this study, we sought to investigate the association between Aβ and p-tau load and structural network topology in non-neurologic brain donors with no or low AD-related pathologic change. Using our combined postmortem in situ MRI and histopathology approach, an association was found between higher Aβ load, predominantly of diffuse type, and measures of lower integration (global efficiency), lower centrality (degree), and lower segregation (lower centrality and higher local efficiency) of brain network organization. Of the analyzed regions, this was particularly the case for the posterior cingulate cortex and precuneus. Changes in network topology in these regions may be explored as an early biological marker for microstructural changes related to Aβ pathology.
Staging of Aβ deposition throughout the brain has been described by Thal et al.31 through postmortem investigation of patients with and without dementia and AD-related pathology. In our study of non-neurologic cases who did not meet the pathologic criteria for AD, most cortical regions showed some extent of Aβ pathology, of which the frontal and parietal regions were generally more abundantly involved, which is consistent with previous findings in the literature.1,6 In addition, Aβ plaques are commonly classified into diffuse or classic plaques based on their morphology.27 Although both types (diffuse and classic) were seen in our cases, they were predominantly of diffuse type. The sequential development of plaques is up for debate: some researchers argue that diffuse plaques evolve over time into dense core plaques,34 while others propose that morphologically distinct plaques have different origins.35 Nevertheless, diffuse plaques are seen more frequently in the earliest stages of Aβ plaque formation, as shown in our and other studies,27 and are more difficult to capture with in vivo PET.36
The preclinical phases of AD are generally associated with Aβ depositions in the absence of p-tau pathology outside the medial temporal lobe.37,38 Due to the sparsity of p-tau in our cohort, mainly some pretangles and aging-related tau astrogliopathy, no association with network topologic measures of integration, centrality, and segregation was found.
A major strength of the current study is the feasibility to create a structural network with subsequent network topology with postmortem in situ MRI data. In situ DTI tractography has shown to be feasible postmortem,39 and structural network topology has been derived from in situ MRI cases based on a group-based structural connectivity atlas in healthy patients in vivo.40 To our knowledge, this study is the first to derive network topology from single-subject in situ MRI cases. Relating network topology results from our study to the in vivo literature, overlap in the highly connected (or hub) regions was seen, such as the precuneus, posterior cingulate, and insular cortex.32,33 Future postmortem in situ MRI studies will need to assess whether other network topology measures (e.g., modularity) show similar consistencies in vivo and in situ.
Structural network alterations in the context of regional Aβ accumulation have been explored in vivo.7,11,41–43 However, most of these studies assessed this relationship across different (e.g., diagnostic) groups, rendering it impossible to interpret a linear association within one specific group (e.g., early Aβ accumulation). For instance, a study by Prescott and colleagues,12 who used Aβ PET to identify regions with Aβ load, found increased cortical Aβ accumulation across diagnostic groups (normal cognition, mild cognitive impairment, and AD) to be associated with a decrease in network degree and local efficiency. In turn, only one study looked at the association between single-subject network topology and continuous Aβ CSF levels in cognitively normal adults. This study found an association between lower Aβ CSF levels (suggesting Aβ accumulation) and lower network degree and lower global efficiency,41 which is in line with the results from our study, suggesting a link between incipient Aβ pathology and reduced centrality and information integration.
Also in line with the study by Tijms et al.41 is the association between Aβ load and a less segregated brain organization. Although there are many methodologic differences between our study and the Tijms et al.41 study, such as method of calculating connectivity (GM structure vs probabilistic tractography) and measure of Aβ load (CSF vs immunohistopathology), they seem to pick up on the same biological process. Nevertheless, further studies are warranted to assess the association between local network clustering and efficiency and Aβ load and accumulation.
A study by Palmqvist and colleagues44 showed that earliest accumulation of Aβ PET occurs within the precuneus and medial orbitofrontal and posterior cingulate cortex, and that Aβ starts accumulating before overt metabolic or atrophy changes. In accordance, Voevodskaya and colleagues11 found changes in network topology to occur before any detectable atrophy in CSF Aβ-positive cognitively normal adults. From our study it can also tentatively be inferred that network topology in the posterior cingulate cortex and precuneus may be a more sensitive marker for early Aβ accumulation than global, GM, or WM atrophy or hippocampal volume, since the latter measures showed no relationship with Aβ load. As such, within the Amyloid, Tau and Neurodegeneration [AT(N)] research framework as proposed by NIA-AA,3 (global or regional) brain network organization changes may be considered as an addition to the (N) group, although cutoff points would need to be explored.
The posterior cingulate cortex has been shown to be a pivotal region susceptible to normal and pathologic aging processes such as Aβ depositions.45 Aβ is believed to disrupt glial support,46 synaptic function,47 axonal transport,48 and/or cell–cell signaling.49 Although a causal relationship between Aβ accumulation and network topology cannot be inferred from our study, further research is necessary to elucidate the interplay of these mechanisms and the potential role for network topology as an early biological marker for microstructural changes related to Aβ pathology.
Clinical information on the included donors was very limited, and no assessment of cognitive status was available, which can be seen as a limitation of our study. A second limitation is the small number of cases, although a previous in vivo study showed feasibility of structural network topology with fewer subjects (n = 5)50; the observed variation in results at different thresholds may be reflected by this limitation. Nevertheless, the topologic measure of degree shows to be relatively robust at different thresholds in our sample. Furthermore, graph theoretical measures such as nodal global and local efficiency may be influenced by a node's network degree. There has not been an optimal methodologic suggestion to account for this,51 and therefore it remains a subject of debate. Finally, although we corrected for possible confounders such as age, sex, and postmortem delay in our study, other factors (e.g., body temperature and other pathologic processes upon death) may influence MRI acquisition and structural network topology and need to be taken into consideration when translating results from the in situ to the in vivo setting. Future imaging studies should further investigate the association between Aβ accumulation, in situ network topology, in vivo network topology, and cognitive outcome in healthy aging and AD.
Clinicopathologic studies indicate that low levels of AD-related pathologic change in cognitively unimpaired individuals are associated with subtle cognitive deficits, specifically within the attention and working memory domain.52 Our study adds to this concept by showing that low levels of AD-related pathologic change are associated with (region-specific) changes in brain network organization. Combined, this suggests an interplay between early AD-related pathologic change, brain network organization, and cognition, which may aid identification of individuals at risk for developing AD.
Understanding the histopathologic signature of structural network topology in decedents without dementia is instrumental for the interpretation of structural network alteration in the living elderly, and by extension in pathologic aging such as AD. This study also highlights the potential importance of posterior cingulate cortex and precuneus network topology as an early marker of Aβ pathologic change.
Acknowledgment
The authors thank the donors of the body donation program and the NABCA MRI and autopsy teams for their continuing efforts.
Glossary
- Aβ42
β-amyloid 42
- AD
Alzheimer disease
- CI
confidence interval
- DAB
diaminobenzidine tetrahydrochloride dehydrate
- DTI
diffusion tensor imaging
- FDR
false discovery rate
- FLAIR
fluid-attenuated inversion recovery
- GM
gray matter
- NABCA
Normal Aging Brain Collection Amsterdam
- NFT
neurofibrillary tangle
- NIA-AA
National Institute of Aging–Alzheimer's Association
- p-tau
hyperphosphorylated tau
- TBS
Tris-buffered saline
- TE
echo time
- TI
inversion time
- TR
repetition time
- WM
white matter
Appendix. Authors

Study funding
L.E.J. receives funding from the Alzheimer Association (Research Fellowship AARF-18-566,459). F.B. is supported by the NIHR biomedical research centre at UCLH. L.D. has received funding from the Netherlands Organization for Scientific Research (NWO Veni 016.146.086) and Society in Science (Branco Weiss Fellowship). W.D.J.v.d.B. is financially supported by grants from Amsterdam Neuroscience, ZonMW Memorabel, ZonMW Technology Hotel, Stichting Parkinson Fonds, Alzheimer Netherlands-LECMA, and contract research for Roche Pharma, Lysosomal Therapeutics, and Crossbeta Sciences.
Disclosure
L. Jonkman, M. Steenwijk, N. Boesen, and A. Rozemuller report no disclosures relevant to the manuscript. F. Barkhof is a consultant for Biogen-Idec, Janssen Alzheimer Immunotherapy, Bayer-Schering, Merck-Serono, Roche, Novartis, Genzyme, and Sanofi-Aventis; has received sponsoring from European Commission–Horizon 2020, National Institute for Health Research–University College London Hospitals Biomedical Research Centre, Scottish Multiple Sclerosis Register, TEVA, Novartis, and Toshiba; is supported by the University College London Hospitals NHS Foundation Trust Biomedical Research Center; and serves on the editorial boards of Radiology, Brain, Neuroradiology, Multiple Sclerosis Journal, and Neurology. J. Geurts is editor for Europe at Multiple Sclerosis Journal and has received research support from Biogen, Sanofi Genzyme, and Novartis Pharma. L. Douw reports no disclosures relevant to the manuscript. W. van de Berg has been a consultant for CHDR Leiden and Lysosomal Therapeutics. Go to Neurology.org/N for full disclosures.
References
- 1.Price JL, Morris JC. Tangles and plaques in nondemented aging and “preclinical” Alzheimer's disease. Ann Neurol 1999;45:358–368. [DOI] [PubMed] [Google Scholar]
- 2.Jagust W. Imaging the evolution and pathophysiology of Alzheimer disease. Nat Rev Neurosci 2018;19:687–700. [DOI] [PMC free article] [PubMed] [Google Scholar]
- 3.Jack CR, Bennett DA, Blennow K, et al. NIA-AA Research Framework: toward a biological definition of Alzheimer's disease. Alzheimer’s Dement 2018;14:535–562. [DOI] [PMC free article] [PubMed] [Google Scholar]
- 4.Sperling R, Mormino E, Johnson K. The evolution of preclinical Alzheimer's disease: implications for prevention trials. Neuron 2014;84:608–622. [DOI] [PMC free article] [PubMed] [Google Scholar]
- 5.Jack CR, Knopman DS, Jagust WJ, et al. . Tracking pathophysiological processes in Alzheimer's disease: an updated hypothetical model of dynamic biomarkers. Lancet Neurol 2013;12:207–216. [DOI] [PMC free article] [PubMed] [Google Scholar]
- 6.Braak H, Braak E. Neuropathological stageing of Alzheimer-related changes. Acta Neuropathol 1991;82:239–259. [DOI] [PubMed] [Google Scholar]
- 7.Pereira JB, Strandberg TO, Palmqvist S, et al. . Amyloid network topology characterizes the progression of Alzheimer's disease during the predementia stages. Cereb Cortex 2018;28:340–349. [DOI] [PMC free article] [PubMed] [Google Scholar]
- 8.Gong G, Rosa-Neto P, Carbonell F, Chen ZJ, He Y, Evans AC. Age- and gender-related differences in the cortical anatomical network. J Neurosci 2009;29:15684–15693. [DOI] [PMC free article] [PubMed] [Google Scholar]
- 9.Yao Z, Zhang Y, Lin L, et al. . Abnormal cortical networks in mild cognitive impairment and Alzheimer's disease. Plos Comput Biol 2010;6:e1001006. [DOI] [PMC free article] [PubMed] [Google Scholar]
- 10.Lo CY, Wang PN, Chou KH, Wang J, He Y, Lin CP. Diffusion tensor tractography reveals abnormal topological organization in structural cortical networks in Alzheimer's disease. J Neurosci 2010;30:16876–16885. [DOI] [PMC free article] [PubMed] [Google Scholar]
- 11.Voevodskaya O, Pereira JB, Volpe G, et al. . Altered structural network organization in cognitively normal individuals with amyloid pathology. Neurobiol Aging 2018;64:15–24. [DOI] [PubMed] [Google Scholar]
- 12.Prescott JW, Guidon A, Doraiswamy PM, Roy Choudhury K, Liu C, Petrella JR. The Alzheimer structural connectome: changes in cortical network topology with increased amyloid plaque burden. Radiology 2014;273:175–184. [DOI] [PMC free article] [PubMed] [Google Scholar]
- 13.Ikonomovic MD, Klunk WE, Abrahamson EE, et al. . Post-mortem correlates of in vivo PiB-PET amyloid imaging in a typical case of Alzheimer's disease. Brain 2008;131:1630–1645. [DOI] [PMC free article] [PubMed] [Google Scholar]
- 14.Thal DR, Attems J, Ewers M. Spreading of amyloid, tau, and microvascular pathology in Alzheimer's disease: findings from neuropathological and neuroimaging studies. J Alzheimers Dis 2014;42(suppl 4):S421–S429. [DOI] [PubMed] [Google Scholar]
- 15.Jonkman LE, Graaf YG, Bulk M, et al. . Normal Aging Brain Collection Amsterdam (NABCA): a comprehensive collection of postmortem high-field imaging, neuropathological and morphometric datasets of non-neurological controls. Neuroimage Clin 2019;22:101698. [DOI] [PMC free article] [PubMed] [Google Scholar]
- 16.Montine TJ, Phelps CH, Beach TG, et al. National Institute on Aging–Alzheimer’s Association guidelines for the neuropathologic assessment of Alzheimer's disease: a practical approach. Acta Neuropathol 2012;123:1–11. [DOI] [PMC free article] [PubMed] [Google Scholar]
- 17.Hyman BT, Phelps CH, Beach TG, et al. . National Institute on Aging–Alzheimer’s Association guidelines for the neuropathologic assessment of Alzheimer's disease. Alzheimer’s Dement. 2012;8:1–13. [DOI] [PMC free article] [PubMed] [Google Scholar]
- 18.Jenkinson M, Beckmann CF, Behrens TEJ, Woolrich MW, Smith SM. FSL. Neuroimage 2012;62:782–790. [DOI] [PubMed] [Google Scholar]
- 19.Chard DT, Jackson JS, Miller DH, Wheeler-Kingshott CAM. Reducing the impact of white matter lesions on automated measures of brain gray and white matter volumes. J Magn Reson Imaging 2010;32:223–228. [DOI] [PubMed] [Google Scholar]
- 20.Greve DN, Fischl B. Accurate and robust brain image alignment using boundary-based registration. Neuroimage NIH Public Access 2009;48:63–72. [DOI] [PMC free article] [PubMed] [Google Scholar]
- 21.Tzourio-Mazoyer N, Landeau B, Papathanassiou D, et al. . Automated anatomical labeling of activations in SPM using a macroscopic anatomical parcellation of the MNI MRI single-subject brain. Neuroimage 2002;15:273–289. [DOI] [PubMed] [Google Scholar]
- 22.Sotiropoulos SN, Zalesky A. Building connectomes using diffusion MRI: why, how and but. NMR Biomed 2019;32:e3752. [DOI] [PMC free article] [PubMed] [Google Scholar]
- 23.Achard S, Bullmore E. Efficiency and cost of economical brain functional networks. Plos Comput Biol Public Libr Sci 2007;3:e17. [DOI] [PMC free article] [PubMed] [Google Scholar]
- 24.Dice LR. Measures of the amount of ecologic association between species. Ecology 1945;26:297–302. [Google Scholar]
- 25.Rubinov M, Sporns O. Complex network measures of brain connectivity: uses and interpretations. Neuroimage Acad Press 2010;52:1059–1069. [DOI] [PubMed] [Google Scholar]
- 26.Latora V, Marchiori M. Efficient behavior of small-world networks. Phys Rev Lett Am Phys Soc 2001;87:198701. [DOI] [PubMed] [Google Scholar]
- 27.Thal DR, Rüb U, Schultz C, et al. Sequence of Abeta-protein deposition in the human medial temporal lobe. J Neuropathol Exp Neurol 2000;59:733–748. [DOI] [PubMed] [Google Scholar]
- 28.Alafuzoff I, Arzberger T, Al-Sarraj S, et al. Staging of neurofibrillary pathology in Alzheimer's disease: a study of the BrainNet Europe Consortium. Brain Pathol 2008;18:484–496. [DOI] [PMC free article] [PubMed] [Google Scholar]
- 29.Benjamini Y, Hochberg Y; Journal of the Royal Statistical Society. Controlling the false discovery rate: a practical and powerful approach to multiple testing. J Royal Stat Soc Series B 1995:57:289–300. [Google Scholar]
- 30.Scheltens P, Leys D, Barkhof F, et al. Atrophy of medial temporal lobes on MRI in “probable” Alzheimer's disease and normal ageing: diagnostic value and neuropsychological correlates. J Neurol Neurosurg Psychiatry 1992;55:967–972. [DOI] [PMC free article] [PubMed] [Google Scholar]
- 31.Thal DR, Rüb U, Orantes M, Braak H. Phases of A beta-deposition in the human brain and its relevance for the development of AD. Neurology 2002;58:1791–1800. [DOI] [PubMed] [Google Scholar]
- 32.Perry A, Wen W, Lord A, et al. . The organisation of the elderly connectome. Neuroimage 2015;114:414–426. [DOI] [PubMed] [Google Scholar]
- 33.van den Heuvel MP, Sporns O. Rich-club organization of the human connectome. J Neurosci 2011;31:15775–15786. [DOI] [PMC free article] [PubMed] [Google Scholar]
- 34.Griffin WS, Sheng JG, Roberts GW, Mrak RE. Interleukin-1 expression in different plaque types in Alzheimer's disease: significance in plaque evolution. J Neuropathol Exp Neurol 1995;54:276–281. [DOI] [PubMed] [Google Scholar]
- 35.D'Andrea M, Nagele R. Morphologically distinct types of amyloid plaques point the way to a better understanding of Alzheimer's disease pathogenesis. Biotech Histochem 2010;85:133–147. [DOI] [PubMed] [Google Scholar]
- 36.Thal DR, Beach TG, Zanette M, et al. . [18F]flutemetamol amyloid positron emission tomography in preclinical and symptomatic Alzheimer's disease: specific detection of advanced phases of amyloid-β pathology. Alzheimers Dement 2015;11:975–985. [DOI] [PubMed] [Google Scholar]
- 37.Braak H, Braak E, Bohl J, Reintjes R. Age, neurofibrillary changes, A beta-amyloid and the onset of Alzheimer's disease. Neurosci Lett 1996;210:87–90. [DOI] [PubMed] [Google Scholar]
- 38.Dickson DW, Crystal HA, Mattiace LA, et al. Identification of normal and pathological aging in prospectively studied nondemented elderly humans. Neurobiol Aging 1992;13:179–189. [DOI] [PubMed] [Google Scholar]
- 39.Flach PM, Schroth S, Schweitzer W, et al. Deep into the fibers! Postmortem diffusion tensor imaging in forensic Radiology. Am J Forensic Med Pathol 2015;36:153–161. [DOI] [PubMed] [Google Scholar]
- 40.Kiljan S, Meijer KA, Steenwijk MD, et al. Structural network topology relates to tissue properties in multiple sclerosis. J Neurol 2018. [DOI] [PMC free article] [PubMed] [Google Scholar]
- 41.Tijms BM, Kate MT, Wink AM, et al. . Gray matter network disruptions and amyloid beta in cognitively normal adults. Neurobiol Aging 2016;37:154–160. [DOI] [PubMed] [Google Scholar]
- 42.Prescott JW, Guidon A, Doraiswamy PM, et al. . The Alzheimer structural connectome: changes in cortical network topology with increased amyloid plaque burden. Radiology 2014;273:175–184. [DOI] [PMC free article] [PubMed] [Google Scholar]
- 43.Sepulcre J, Sabuncu MR, Becker A, Sperling R, Johnson KA. In vivo characterization of the early states of the amyloid-beta network. Brain 2013;136:2239–2252. [DOI] [PMC free article] [PubMed] [Google Scholar]
- 44.Palmqvist S, Schöll M, Strandberg O, et al. . Earliest accumulation of β-amyloid occurs within the default-mode network and concurrently affects brain connectivity. Nat Commun 2017;8:1214. [DOI] [PMC free article] [PubMed] [Google Scholar]
- 45.Buckner RL, Sepulcre J, Talukdar T, et al. . Cortical hubs revealed by intrinsic functional connectivity: mapping, assessment of stability, and relation to Alzheimer's disease. J Neurosci 2009;29:1860–1873. [DOI] [PMC free article] [PubMed] [Google Scholar]
- 46.Chen J, Zhou Y, Mueller-Steiner S, et al. . SIRT1 protects against microglia-dependent amyloid-β toxicity through inhibiting NF-κB signaling. J Biol Chem 2005;280:40364–40374. [DOI] [PubMed] [Google Scholar]
- 47.Palop JJ, Mucke L. Synaptic depression and aberrant excitatory network activity in Alzheimer's disease: two faces of the same coin? Neuromolecular Med 2010;12:48–55. [DOI] [PMC free article] [PubMed] [Google Scholar]
- 48.Wirths O, Weis J, Szczygielski J, Multhaup G, Bayer TA. Axonopathy in an APP/PS1 transgenic mouse model of Alzheimer's disease. Acta Neuropathol 2006;111:312–319. [DOI] [PubMed] [Google Scholar]
- 49.Garden GA, La Spada AR. Intercellular (Mis)communication in neurodegenerative disease. Neuron 2012;73:886–901. [DOI] [PMC free article] [PubMed] [Google Scholar]
- 50.Hagmann P, Cammoun L, Gigandet X, et al. . Mapping the structural core of human cerebral cortex. PLoS Biol 2008;6:e159. [DOI] [PMC free article] [PubMed] [Google Scholar]
- 51.van Wijk BCM, Stam CJ, Daffertshofer A. Comparing brain networks of different size and connectivity density using graph theory. PLoS One 2010;5:e13701. [DOI] [PMC free article] [PubMed] [Google Scholar]
- 52.Bennett DA, Wilson RS, Boyle PA, Buchman AS, Schneider JA. Relation of neuropathology to cognition in persons without cognitive impairment. Ann Neurol 2012;72:599–609. [DOI] [PMC free article] [PubMed] [Google Scholar]
Associated Data
This section collects any data citations, data availability statements, or supplementary materials included in this article.
Data Availability Statement
Data are available upon reasonable request through NABCA (nabca.eu).15


