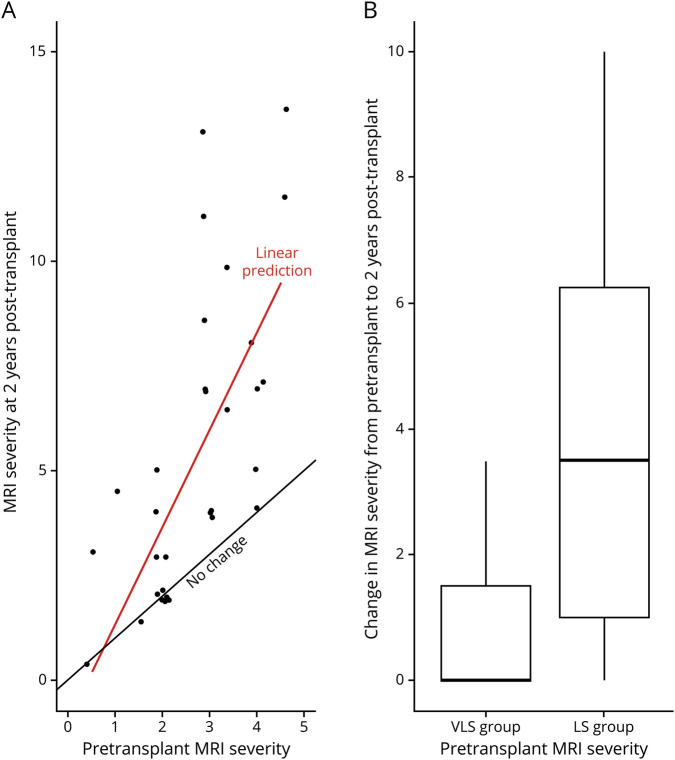
Figure 3. MRI progression by initial lesion severity 2 years following transplantation for cerebral adrenoleukodystrophy.
(A) Scatterplot of pretransplant MRI severity vs 2-year MRI outcomes shows greater radiographic disease progression associated with higher pretransplant MRI score. The red line represents the regression line fitted to the data that were obtained. A black comparison line depicts the slope had there been no change in patient MRI scores from baseline to 2-years posttransplant. (B) Boxplots compare the change in MRI severity score from pretransplant to 2 years post-transplant in the very low severity (VLS) group (pretransplant MRI severity 0.5–2) and the low severity (LS) group (pretransplant MRI severity 2.5–4.5). The lower and upper box boundaries correspond to the first and third quartiles (the 25th and 75th percentiles), with a black line at the median. For the VLS group, median change in MRI severity was 0 points; for the LS group, median change was 3.5 points. Vertical lines extend to the largest value no more than 1.5 times the interquartile range from the box boundary.

