Abstract
Objective
We studied interrelationships between CSF biomarkers and associations with APOE ε4 genotype, demographic variables, vascular variables, and clinical diagnosis in Olmsted County, Minnesota.
Methods
We included 774 Mayo Clinic Study of Aging participants (693 cognitively unimpaired [CU]; 71 with mild cognitive impairment [MCI]). CSF β-amyloid 42 (Aβ42), total tau (t-tau), and hyperphosphorylated tau (p-tau) were analyzed using Aβ42 CSF, t-tau CSF, and p-tau (181P) CSF electrochemiluminescence immunoassays. Bivariate mixture models were used to evaluate latent classes. We used linear regression models to evaluate independent associations of APOE ε4, demographic factors, cardiovascular risk, and diagnosis with CSF biomarker levels. Results were weighted back to the Olmsted County population.
Results
Interrelationships between CSF Aβ42 and p-tau/t-tau were consistent with 2 latent classes in the general population. In subgroup 1 (n = 547 [71%]), we found a strong positive correlation between Aβ42 and p-tau (ρ = 0.81), while the correlation was much smaller in group 2 (ρ = 0.26, n = 227 [29%]). Group 2 was associated with older age, APOE ε4 genotype, a diagnosis of MCI, and elevated amyloid PET. Overall, APOE ε4 genotype and MCI were associated with Aβ42, while age was associated with p-tau/t-tau. There were no associations with sex, education, or vascular risk.
Conclusion
We hypothesize the population without dementia can be subdivided into participants with and without biological Alzheimer disease (AD) based on the combination of CSF Aβ42 and p-tau/t-tau (represented also by the p-tau/t-tau/Aβ42 ratio). In those without biological AD, common factors such as CSF dynamics may cause a positive correlation between CSF Aβ42 and p-tau/t-tau, while AD leads to dissociation of these proteins.
With disease-modifying therapies being investigated early in the clinical course of Alzheimer disease (AD), it is becoming increasingly important to categorize asymptomatic persons based on the presence of biological AD. This can be done in vivo by investigating a person’s AD biomarker status.1 This will be even more relevant when disease-modifying therapies become available. Two accepted methods to evaluate the presence of biological AD exist: amyloid PET and CSF biomarkers.1 Of these, CSF biomarkers have the advantage of being cheaper and more widely available than amyloid PET.
Interpretation of results from studies including persons with dementia and results from therapeutic trials in early AD could be facilitated with more knowledge about the characteristics of CSF biomarkers in the general population. To date, studies focusing on the relationships between CSF biomarkers and demographic variables or APOE genotype predominantly consist of volunteer samples or memory clinic–based cohorts, which may not be representative of findings in the general population.2–10 In addition, the largest samples stem from multicenter studies, interpretation of which may be hampered by high between-laboratory variability of CSF measurements.11
In the current study, we aimed to provide a background to existing studies regarding CSF biomarkers. When one wants to interpret biomarker findings in therapeutic trials or memory clinic cohorts, it is important to know how these biomarkers behave in the general population. Data in cognitively unimpaired participants and participants with mild cognitive impairment (MCI) may be especially important, because damage to the brain may be reversible in these stages. Therefore, we studied interrelationships between CSF biomarkers and their associations with APOE genotype, demographic variables (age, sex, and education), vascular health, and clinical diagnosis in a randomly selected population without dementia using data from the Mayo Clinic Study of Aging (MCSA).
Methods
Participants
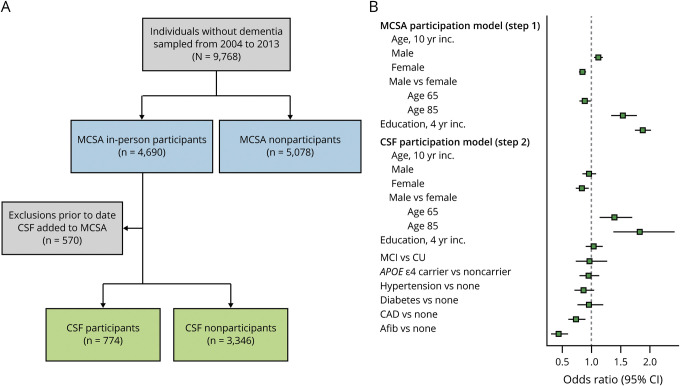
The MCSA is a population-based study of cognitive aging that was established in Olmsted County, Minnesota, in October 2004. Details of the study design and participant recruitment are provided elsewhere.12,13 Utilizing the Rochester Epidemiology Project medical records linkage system, Olmsted County residents are enumerated and randomly identified for the MCSA using an age- and sex-stratified random sampling scheme.14 Participants aged 70–89 years were originally recruited and beginning in 2015, recruitment was expanded to participants aged 50–89 years. From November 2007 through August 2016, a subset of MCSA participants (n = 774) who were cognitively unimpaired (CU) or had MCI underwent lumbar puncture (figure 1). These individuals were included in the current study.
Figure 1. Flow chart of the study design and summary of participation models.
(A) Flow chart detailing the study design. The blue boxes enumerate in-person participation in the Mayo Clinic Study of Aging (MCSA) vs nonparticipation. The nonparticipants include 1,815 individuals who participated by telephone only and 3,263 who refused to participate. (B) Summary of logistic regression models used for inverse probability weighting to account for potential participation bias. The green points in step one show the odds ratios (95% confidence interval [CI]) for variables in the MCSA participation model. The green points in step 2 show the odds ratios (95% CI) for variables in the CSF participation model. A total of 570 individuals who participated in the MCSA progressed to dementia, died, or were lost to follow-up prior to the start of CSF inclusion in November 2007. Afib = atrial fibrillation; CAD = coronary artery disease; CI = confidence interval; CU = cognitively unimpaired; MCI = mild cognitive impairment.
Diagnostic evaluation
All MCSA participants undergo a clinical and cognitive assessment every 15 months that includes separate assessments by a study coordinator, physician, and neuropsychologist. The assessment includes 9 neuropsychological tests covering the following 4 cognitive domains: executive functioning (Trail-Making Test B and Digit Symbol Substitution from the Wechsler Adult Intelligence Scale–Revised [WAIS-R]),15,16 language (Boston Naming Test and Category Fluency),17,18 memory (Wechsler Memory Scale–Revised16 [WMS-R] Logical Memory II [delayed recall], WMS-R Visual Reproduction II [delayed recall],19 and Auditory Verbal Learning Test [delayed recall]),20 and visuospatial functions (WAIS-R Picture Completion and Block Design). After all evaluations have been completed, participants are assigned a diagnosis by consensus based on published criteria and without knowledge of CSF biomarker status.21 This study was limited to those who were CU or had MCI.
Standard protocol approvals, registrations, and patient consents
The institutional review boards of the Mayo Clinic and the Olmsted Medical Center approved all study protocols and written informed consent was obtained from all participants.
CSF analysis
CSF samples were obtained by lumbar puncture between the L3 and L4 intervertebral space. Lumbar puncture was performed early in the morning after fasting. CSF was collected and stored at −80°C in polypropylene tubes. All samples were thawed once prior to analysis. CSF β-amyloid 42 (Aβ42), total tau (t-tau), and hyperphosphorylated tau (p-tau) were analyzed using Elecsys (Lenexa, KS) Aβ(1–42) CSF, Elecsys total-tau CSF, and Elecsys phospho-tau (181P) CSF electrochemiluminescence immunoassays (Roche Diagnostics, Basel, Switzerland). Prior to performing the analysis of the samples included in this article, a thorough quality control procedure was performed to determine precision and accuracy of these analyses in our laboratory. Low and high concentration controls provided by Roche Diagnostics were measured. Overall within-laboratory precision (coefficient of variation) in a CSF pool was 2.1% for Aβ42, 6.8% for t-tau, and 2.3% for p-tau. Recovery based on 80 spiked high and low concentration controls (Elecsys PreciControl samples) was 99.5%–101% for Aβ42, 97.6%–99.2% for t-tau, and 97.9%–98.2% for p-tau. During the main trial, Elecsys PreciControl samples were used to monitor quality. Westgard rules were not violated. All analyses were performed using 1 reagent lot for each biomarker. A total of 135 samples (17%) had an Aβ42 value above the upper technical limit of 1,700 pg/L. No individuals had CSF Aβ42 less than the lower technical limit of 200. The Elecsys Aβ(1–42) CSF immunoassay in use is not a commercially available in vitro diagnostic assay. It is an assay that is currently under development and for investigational use only. The measuring range of the assay is 200 (lower technical limit)–1,700 pg/mL (upper technical limit). The performance of the assay beyond the upper technical limit has not been formally established. Therefore, use of values above the upper technical limit, which are provided based on an extrapolation of the calibration curve, is restricted to exploratory research purposes and is excluded for clinical decision-making or for the derivation of medical decision points. Therefore we did not truncate CSF Aβ42 at a maximum value for this study. Nine samples (1%) had p-tau values below the lower technical limit of 8 pg/L and 4 (0.5%) had t-tau values below the lower technical limit (80 pg/L). These values were set to 1 below the limit. No p-tau or t-tau values were above the upper technical limits of 120 pg/L or 1,300 pg/L, respectively.
Evaluation of vascular factors
We used a cardiovascular and metabolic conditions (CMC) score as a global indicator of vascular health. This score is based on 7 cardiovascular and metabolic conditions proposed by the US Department of Health and Human Services in 2010 as indicators of vascular health: hypertension, hyperlipidemia, cardiac arrhythmias, coronary artery disease, congestive heart failure, diabetes mellitus, and stroke.22 The CMC score represents the summation of the presence or absence of each of these conditions based on ICD-10 codes.
Amyloid PET imaging
A subset of our participants underwent amyloid PET imaging within 1 year of lumbar puncture. Amyloid PET imaging was performed with 11C Pittsburgh compound B (11C PiB). Late uptake amyloid PET images were acquired from 40 to 60 minutes after injection. A standardized uptake value ratio (SUVR) was formed from the voxel number weighted average of the median uptake in the prefrontal, orbitofrontal, parietal, temporal, anterior, and posterior cingulate, and precuneus regions of interest normalized to the cerebellar crus as described previously.23,24 Abnormal 11C PiB uptake was defined as ≥1.48 SUVR based on updated processing pipelines and methods described in Jack et al.25
Statistical analyses
Correlations between CSF biomarkers were assessed using Spearman rank correlations. Because visual inspection of the Aβ42 vs p-tau and t-tau scatter plots suggested a bivariate relationship, we performed bivariate mixture modeling of Aβ42 and p-tau to assess whether the overall pattern was consistent with the presence of 1, 2, or 3 subgroups. This generalizes the commonly used approach of fitting a univariate 2-group mixture model to only Aβ42 by extending it to a bivariate mixture model based on 2 biomarkers. Because of the high correlation between CSF t-tau and CSF p-tau, we performed mixture modeling only for p-tau. The mixture model was performed using the mclust function from the mclust package in R (version 5.3).26 A 2-group classification was found to fit the data best. We then used the estimated mixture model based probability of belonging to each subgroup to classify individuals. To better understand factors associated with subgroup membership, we used logistic regression. Results are shown as odds ratios (ORs) with 95% confidence intervals (CIs). All models except those investigating main effects of age, sex, education, and APOE genotype were adjusted for age.
CSF biomarker associations with age, sex, education, APOE genotype, CMC score, and clinical diagnosis (CU or MCI) were assessed using multivariable linear regression models. Outcome measures were log-transformed CSF Aβ42, t-tau, p-tau, t-tau/Aβ42 ratio, and p-tau/Aβ42 ratio. Models were also fit stratified by APOE ε4 genotype. Differences in the CSF biomarkers by age, sex, education, CMC score, and clinical diagnosis effects among APOE ε4 carriers and noncarriers were assessed. Linear regression model estimates were back-transformed to obtain percentage change estimates.
We used inverse probability weights (IPWs) to account for potential participation bias in the CSF study in order to generalize the results from the studied cohort to the Olmsted County, Minnesota, population. IPWs were determined using a 2-stage approach. First, a multivariable logistic regression model was fit to determine the probability of participating in the MSCA using age, sex, and education as covariates (figure 1). This model included 9,768 individuals (4,690 MCSA participants and 5,078 nonparticipants). Next, a logistic regression model was fit to determine the probability of CSF participation among MCSA participants including the following variables: age, sex, education, clinical diagnosis, APOE ε4 carriership, and cardiovascular risk factors (hypertension, diabetes, coronary artery disease [CAD], and atrial fibrillation). This model included 4,120 individuals (3,346 MCSA participants without CSF results and 774 MCSA participants with CSF results). Both models also included an age × sex interaction. The inverse probabilities in the first and second logistic regression models were multiplied together to get the overall IPW for each individual. These IPWs were included in the logistic and linear regression models described above and we show both unweighted and weighted results for most analyses. These survey weights were incorporated into the analysis using the svyglm function in the survey package in R (version 3.32–1).
Data availability
Data will be shared by request from a qualified investigator in accordance with the MCSA data-sharing protocol.
Results
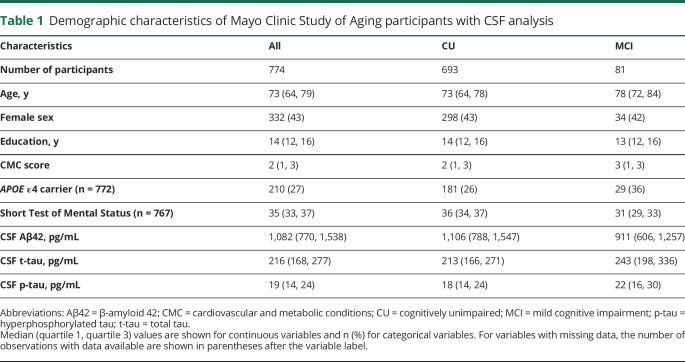
Characteristics of the CSF participants are shown in table 1. Their median age was 73 (interquartile range [IQR] 64–79), 332 (43%) were female, and 210 (27%) were APOE ε4 carriers. They had a median education of 14 (IQR 12–16) years and a median CMC score of 2 conditions (IQR 1–3). Hypertension and dyslipidemia were the most common conditions (over half of the study population affected), while the other conditions were present less frequently. MCSA participants who underwent lumbar puncture were more often male than those who did not undergo lumbar puncture. They had less frequent CAD (OR, 0.74; 95% CI, 0.61–0.90) and less frequent atrial fibrillation (OR, 0.44; 95% CI, 0.32–0.60, figure 1). Women who underwent lumbar puncture were younger on average than women who did not undergo lumbar puncture.
Table 1.
Demographic characteristics of Mayo Clinic Study of Aging participants with CSF analysis
Relationships between different CSF biomarkers
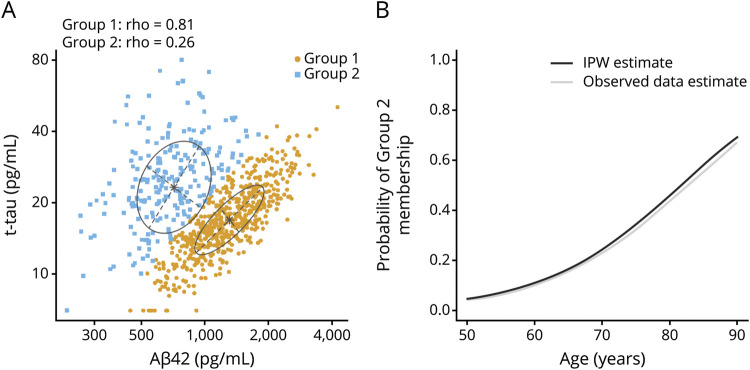
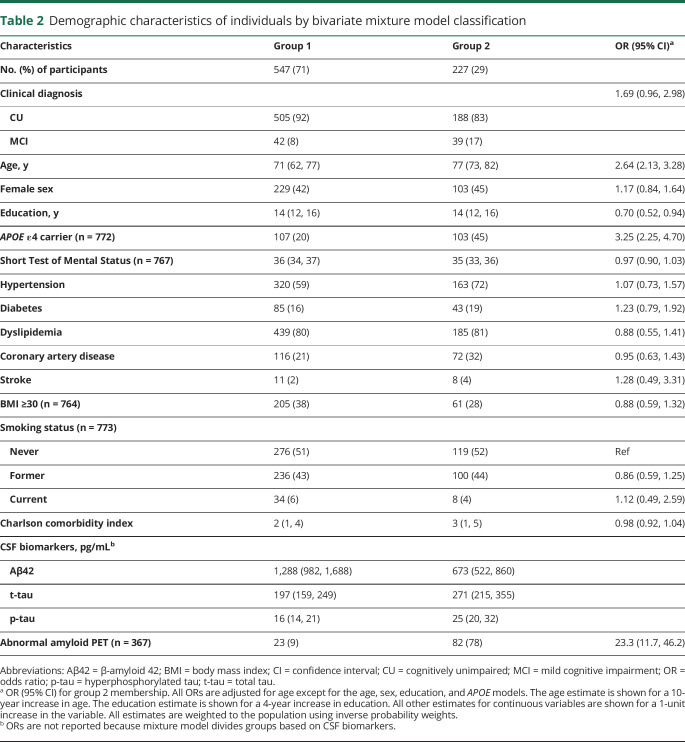
Among the entire group, we found a positive correlation between CSF Aβ42 and both CSF t-tau and p-tau (ρ = 0.30 and 0.25, respectively, p < 0.001; figure 2). We also found a very high positive correlation between CSF t-tau and p-tau (ρ = 0.98, p < 0.001). Using bivariate mixture modeling of the Aβ42 and p-tau values, the data pattern was consistent with 2 underlying subgroups. The resulting classification of participants is shown in figure 3. Most participants clearly belonged to one group or the other, with 89% of participants having >0.80 probability of belonging to one of the 2 groups. Based on the fitted model, the correlation between CSF Aβ42 and CSF p-tau was 0.81 in group 1, but only 0.26 in group 2. Participants in group 2 (n = 227 [31%]) had lower CSF Aβ42 and higher CSF t-tau and p-tau values than those in group 1 (n = 547 [71%]) (table 2). Age was associated with group 2 membership (OR, 2.6 [2.1–3.3] for a 10-year difference in age) such that the probability of group 2 membership increased from 4% at age 50 to 69% at age 90 (figure 3).
Figure 2. Relationships among the CSF biomarker measures.
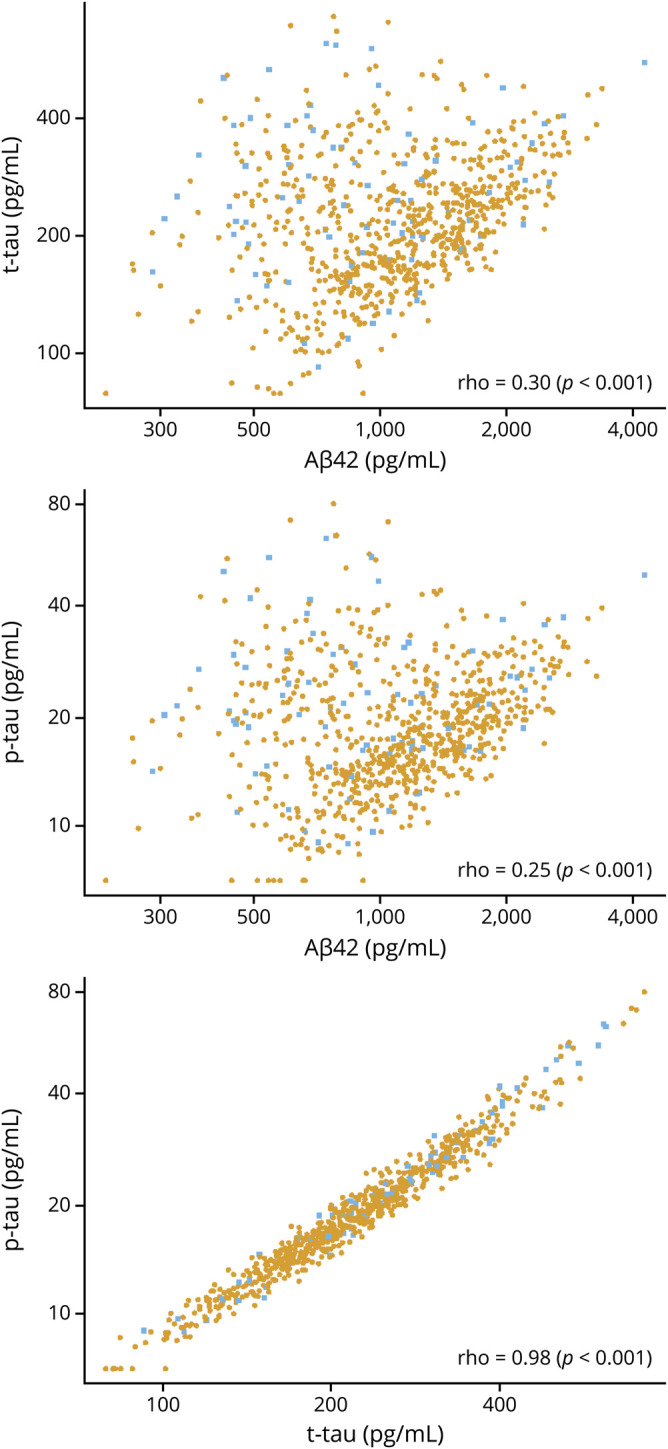
Pairwise scatterplots of CSF biomarkers. Spearman rank correlations are shown for each panel. Individual points are colored by clinical diagnosis (gold for cognitively unimpaired and blue for mild cognitive impairment). Aβ42 = β-amyloid 42; p-tau = hyperphosphorylated tau; t-tau = total tau.
Figure 3. Bivariate mixture model of CSF hyperphosphorylated tau (p-tau) and β-amyloid 42 (Aβ42).
(A) Scatterplot of CSF p-tau vs Aβ42 with classification of individuals into 2 groups defined using a bivariate mixture model (gold points for group 1 and blue for group 2). (B) Estimated probability of group 2 membership vs age after inverse probability weighting (IPW) to adjust for potential participation bias (black). Unweighted estimates from the observed data are shown in gray. Group 2 is presumed to represent a latent group with biological Alzheimer disease. t-tau = total tau.
Table 2.
Demographic characteristics of individuals by bivariate mixture model classification
Among the subset of 367 participants who had also undergone amyloid PET imaging, an abnormal amyloid PET scan was present in 78% of the participants in group 2, while this was the case in only 9% of the participants in group 1 (OR, 23.3 [11.7–46.2]; table 2). Therefore this mixture model classification resulted in a positive predictive value of 78% and a negative predictive value of 91%. In addition, participants in group 2 were more often diagnosed with MCI (age adjusted OR, 1.7 [1.0–3.0]) and much more often APOE ε4 carriers (age-adjusted OR, 3.3 [2.3–4.7]) than participants in group 1. We found no association between vascular disease or vascular risk factors and group membership after adjusting for age.
Association between demographic variables, vascular variables, APOE genotype, and CSF biomarker levels
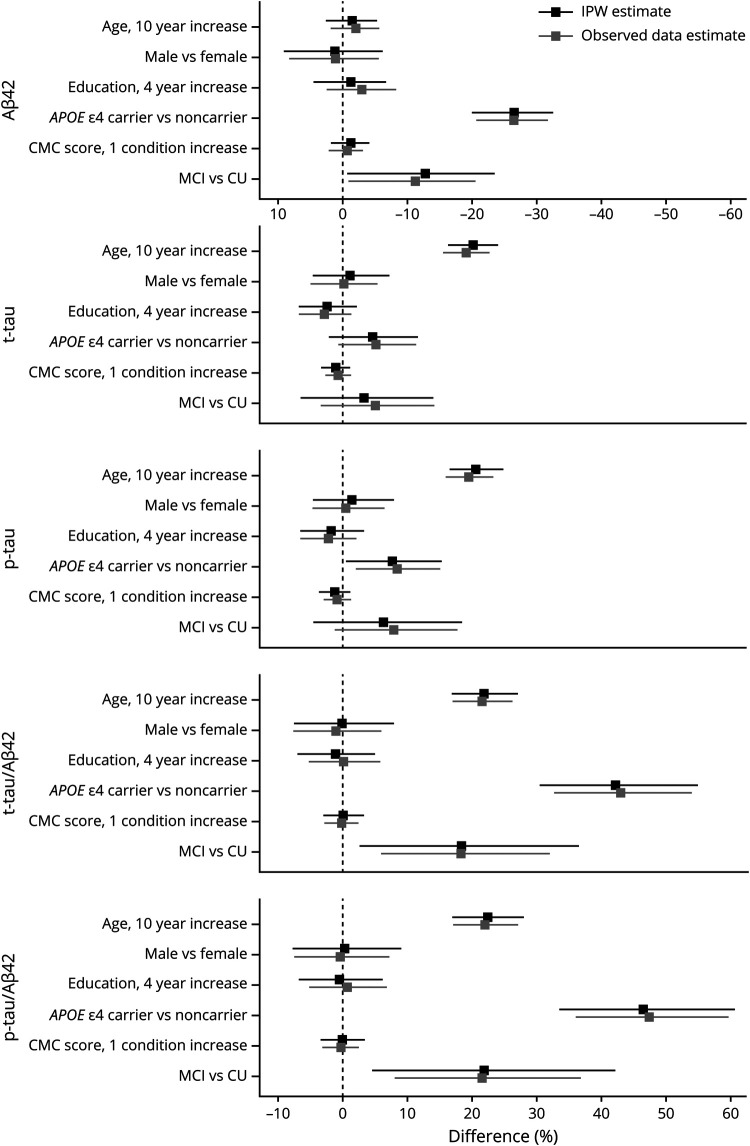
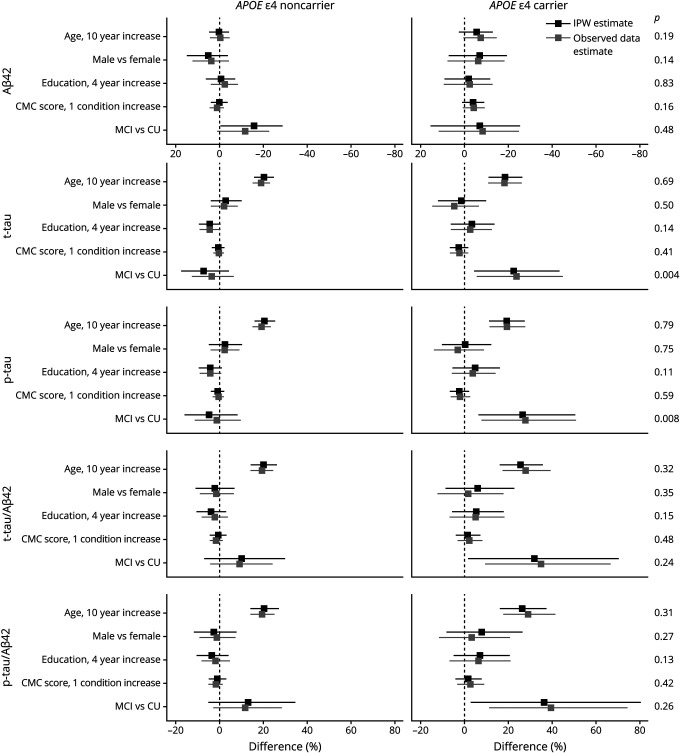
In a multivariable regression model, mean CSF Aβ42 varied little with age, sex, education, or CMC score but was 26% (20%–32%) lower in APOE ε4 carriers than noncarriers (p < 0.001; figure 4). When stratified by APOE genotype, a 10-year increase in age was associated with a decrease in CSF Aβ42 of −6% (95% CI, −13%, 2%), although this was not significant (p = 0.15). There was no difference in CSF Aβ42 by age in noncarriers (0% [−4%, 5%]) (figure 5). Among APOE ε4 carriers, CSF Aβ42 was lower (−7% [−19%, 7%]) in men than women, though this was not significant (p = 0.30). Among APOE ε4 noncarriers, CSF Aβ42 was higher (5% [−4%, 15%]) in men than women, but this was not significant (p = 0.25). Education was not significantly associated with CSF Aβ42 in either APOE ε4 carriers or noncarriers. An increase of 1 condition in the CMC score was associated with a decrease of −4% (−8%, 1%) in CSF Aβ42 for noncarriers, but this was not significant (p = 0.09). There was no difference in CSF Aβ42 by CMC score in noncarriers (0% [−3%, 4%]).
Figure 4. CSF associations with age, sex, education, APOE genotype, vascular risk, and clinical diagnosis.
The estimated mean % difference (95% confidence interval) in CSF measures are shown for different covariate contrasts. Estimates are from linear regression models (separate models for each CSF outcome) with age, sex, education, APOE genotype, and clinical diagnosis as additive effects. Inverse probability weighted (IPW) estimates account for potential participation bias. Aβ42 = β-amyloid 42; CMC = cardiovascular and metabolic conditions; CU = cognitively unimpaired; MCI = mild cognitive impairment; p-tau = hyperphosphorylated tau; t-tau = total tau.
Figure 5. CSF associations with age, sex, education, vascular risk, and clinical diagnosis within APOE ε4 noncarriers and carriers.
The estimated mean % difference (95s% confidence interval) in CSF measures are shown for different covariate contrasts. Estimates are from linear regression models (separate models for each CSF outcome and by APOE genotype) with age, sex, education, and clinical diagnosis as additive effects. Inverse probability weighted (IPW) estimates account for potential participation bias. p Values from tests of differences in effects among APOE ε4 carriers and noncarriers are shown on the right axis. Aβ42 = β-amyloid 42; CMC = cardiovascular and metabolic conditions; CU = cognitively unimpaired; MCI = mild cognitive impairment; p-tau = hyperphosphorylated tau; t-tau = total tau.
Results regarding CSF t-tau and p-tau were similar. In multivariable regression models, a 10-year increase in age was associated with a 20% (16%–24%) increase in mean CSF t-tau and a 21% (17%–25%) increase in p-tau. Mean CSF p-tau was higher in APOE ε4 carriers than in noncarriers (8% [1%–15%]); the APOE effect for t-tau was smaller and not significant (5% [−2%, 11%]). Sex, education, and CMC score were not associated with CSF t-tau or p-tau in overall models. Results were similar when stratifying by APOE ε4 genotype.
A 10-year increase in age was associated with a 22% (17%–27%) higher CSF t-tau/Aβ42 and a 22% (17%–28%) higher p-tau/Aβ42 ratio (figure 3). We found no associations between sex, education, or CMC score and CSF t-tau/Aβ42 or p-tau/Aβ42 ratios. Presence of the APOE ε4 genotype was associated with a 42% (31%–55%) higher CSF t-tau/Aβ42 and 46% (34%–60%) higher p-tau/Aβ42 ratio. Again, results were similar when stratifying by APOE ε4 genotype.
Association between clinical diagnosis and CSF biomarker levels
Participants with MCI had 13% (1%–23%) lower CSF Aβ42 concentrations than CU participants (figure 4). The effect size was similar among APOE ε4 noncarriers (−16% [−29%, −1%]). While the effect was attenuated among APOE ε4 carriers (−7% [−25%, 15%]), it was not significantly different from the effect among noncarriers (p = 0.48; figure 5). In contrast, t-tau and p-tau were not significantly associated with MCI diagnosis in the overall models but the effect of an MCI diagnosis on t-tau and p-tau did differ between APOE ε4 carriers and noncarriers (p = 0.004 for t-tau and 0.008 for p-tau). Among carriers, CSF t-tau was 23% (5%–43%) higher in individuals with MCI vs CU and CSF p-tau was 27% (7%–50%) higher in MCI. In APOE ε4 noncarriers, an MCI diagnosis was not associated with CSF t-tau or p-tau concentrations. t-tau/Aβ42 and p-tau/Aβ42 ratios were higher in participants with MCI than in CU participants (18% [3%–36%] for t-tau/Aβ42, 22% [5%–42%] for p-tau/Aβ42) overall. While the effect sizes did not significantly differ between APOE ε4 carriers and noncarriers, the effect sizes were somewhat more pronounced in APOE ε4 carriers.
We report the main results after weighting to adjust for participation bias but results without weighting were similar (figures 4 and 5).
Discussion
We provide evidence that persons without dementia from the general population can be classified into 2 subgroups based on the combination of CSF Aβ42 and p-tau/t-tau. Because group 2 membership was very closely related to abnormal amyloid PET and to known risk factors for AD dementia, we would propose that group 2 is enriched for participants with biological AD while group 1 is not.
Based on data from memory clinic cohorts, one might have expected that CSF Aβ42 and p-tau/t-tau would be negatively correlated.27 However, consistent with results from a recent multicohort study, we did not find a negative correlation in our population-based sample of participants without dementia.28 Instead, we found an overall positive correlation between the 2 biomarkers and a relative lack of individuals with high/normal CSF Aβ42 and low/normal CSF p-tau/t-tau.
In subsequent analyses, we identified 2 groups of participants and they were found to have very different correlations between Aβ42 and p-tau. In group 1, presumably without biological AD, we found a strongly positive correlation between Aβ42 and p-tau. This would suggest the existence of a common denominator driving the concentrations of both proteins. Among other possibilities, such a common denominator may be a process related to normal aging, such as decreasing CSF production or clearance with age or generally increased protein production due to age-related changes in regulatory RNA species.29–32 In group 2, presumably with biological AD, the correlation between CSF Aβ42 and p-tau is much smaller (but still positive), indicating a relative dissociation of the 2 proteins. In this group, CSF Aβ42 is generally lower, while there is a fairly wide range of p-tau values. This would be consistent with an early stage of AD. This conclusion is further supported by the association of group 2 membership with abnormal amyloid PET and known risk factors for AD. Notably, group 2 membership was not associated with vascular disease or vascular risk factors after adjusting for age. This is largely in line with neuropathologic data in elderly individuals without dementia.33
Our findings may have important consequences for interpretation of CSF biomarkers. They suggest CSF biomarkers cannot be interpreted in isolation. For example, 2 recent publications suggested a cut point for Aβ42 of 1,092 ng/L using the same Elecsys assay that we used.34,35 Because of decreased interlaboratory variation when using the Elecsys assay, such a cut point is thought to be more universally applicable than cut points based on older assays.11 However, our data indicate that a substantial number of participants with CSF Aβ42 below this cut point may not have biological AD (or AD pathologic change), while a small number above the cut point do. The same is true when applying a cut point for p-tau/t-tau in isolation; some participants may be classified as normal or—combined with an isolated cut point for CSF Aβ42—as suspected non-Alzheimer pathology, while they actually have biological AD. Based on a prior publication that included individuals without dementia from multiple cohorts, our results are not unique to 1 population or to use of the Elecsys assay.28 A solution might be to use the CSF Aβ42/Aβ40 ratio instead of Aβ42 in isolation. When evaluating concordance between CSF biomarkers and amyloid PET imaging, the Aβ42/Aβ40 ratio and the p-tau/t-tau to Aβ42 ratio seem to perform similarly.35 Based on accumulated evidence, use of the Aβ42/Aβ40 ratio was recently proposed to be a better diagnostic marker for AD than use of Aβ42 in isolation.36 Advantages of the use of the Aβ42/Aβ40 ratio include correction for general amyloid precursor protein processing rate and preanalytical variation. Still, the positive correlation between CSF Aβ42 and tau in our data warrants the hypothesis that there is another process—shared by Aβ42 and tau—that also accounts for part of the CSF levels of these proteins. When only Aβ42 values—and not (p)tau values—are adjusted, this common process is insufficiently accounted for. In that regard, use of the p-tau/t-tau to Aβ42 ratio may provide a solution. Alternatively, we may have to search for a protein that accurately reflects CSF production and clearance rates to use for normalizing CSF concentrations. This latter option would be preferable because use of the p-tau/t-tau to Aβ42 ratio has consequences for the categorization of CSF biomarkers according to the recently proposed ATN framework.37 In light of our results, it may be needed to make changes to the categorization of CSF biomarkers within this framework. Such changes would be in line with the flexible nature of the ATN framework.
We found age, APOE ε4 genotype, and clinical diagnosis were associated with CSF biomarkers in the general population. For Aβ42, APOE ε4 genotype and a diagnosis of MCI were independently associated with lower concentrations, whereas age was the variable most clearly associated with t-tau and p-tau. Concentrations of t-tau and p-tau increased with age irrespective of APOE genotype, but MCI was only associated with higher concentrations of these proteins in APOE ε4 carriers.
Similar to the current study, several smaller studies have not found an association between CSF Aβ42 and age, especially in APOE ε4 noncarriers.1,4,6,9 In contrast, 2 large multicenter studies, which were partly based on overlapping cohorts, did find an association between age and CSF Aβ42 in APOE ε4 noncarriers and carriers.2,38 Prior reports from the MCSA indicate increasing levels of amyloid PET ([11C] Pittsburgh compound B) and higher prevalence of abnormal amyloid PET with age among APOE ε4 carriers and noncarriers.39,40 Therefore, we propose that the most likely explanation for not finding an association between age and CSF Aβ42 may be that the age effect is less easily detected in CSF than when using amyloid PET imaging.41 One has to keep in mind that these modalities differ in what they measure: amyloid PET reflects the accumulation of amyloid in the brain up until a certain time point, while CSF Aβ42 reflects both production and clearance from the CSF at a single time point. Among other reasons, the lack of an association between age and CSF Aβ42 could be due to changes in CSF dynamics with age. Several studies have suggested CSF production decreases with age, which (if removal rates were not changed) would keep Aβ42 concentrations artificially high, thus obscuring small decreases in CSF Aβ42 concentration with age.30–32 This explanation may be feasible, because it also explains the positive correlation between CSF Aβ42 and (p/t)-tau. If one assumes, however, that CSF dynamics remain unchanged with aging, the lack of an Aβ42–age association could be due to changes in Aβ42 kinetics. Based on a prior publication, 2 age-associated mechanisms leading to opposite effects on CSF Aβ42 concentrations could explain our findings. (1) The Aβ42 turnover rate was found to slow with aging.42 This could lead to higher CSF Aβ42 concentrations with age, especially in the group without biological AD. (2) In persons who were amyloid-positive irreversible loss of Aβ42 monomers was found to be increased (hypothetically due to plaque formation; also an age-associated process).42 This could lead to lower CSF concentrations in the subset of our participants with biological AD or AD pathologic change. The mixture of these 2 effects could lead to a net result of no change with aging in our cohort. Alternatively, characteristics of the Elecsys assay may be such that interference with other Aβ species differs from the older assays used in prior studies, which might lead to a more representative age effect when the Aβ42/40 ratio is used.1,35 Furthermore, changes in CSF Aβ42 concentrations may precede those in amyloid PET imaging, so CSF Aβ42 may have reached a plateau for most individuals prior to inclusion in the current study.43 A possible—if somewhat less likely—alternative explanation may be that the MCSA is a population-based study, while the multicenter studies that did find an association between age and CSF Aβ42 in APOE ε4 noncarriers consisted of volunteer samples or memory clinic cohorts.2,38 For example, if such convenience samples had an overrepresentation of those with preclinical AD, CSF Aβ42 may be lower on average among older participants, resulting in an observed age association.
Modeling the effect of clinical diagnosis on CSF biomarkers can be seen as a way to gain insight into biomarker dynamics in spite of investigating a cross-sectional sample. Among APOE ε4 carriers, our results support a dynamic biomarker model in which changes in amyloid precede those in t-tau or p-tau.44 APOE ε4 carriership itself predicted lower CSF Aβ42 and the most prominent additional change associated with MCI in APOE ε4 carriers was an increase in CSF tau instead of Aβ42. Results in APOE ε4 noncarriers were somewhat less clear. A diagnosis of MCI predicted lower CSF Aβ42, but was not associated with a change in CSF t-tau or p-tau. If one views the p-tau/t-tau to Aβ42 ratio as the best reflection of (preclinical) AD, then we confirm prior evidence that age is the most prominent risk factor for AD in APOE ε4 carriers and noncarriers. A diagnosis of MCI was independently associated with a higher p-tau/t-tau to Aβ42 ratio in APOE ε4 carriers, and to a lesser extent in noncarriers. These results highlight the need to investigate APOE ε4 carriers and noncarriers separately to further elucidate differences between the emergence of AD in either genotype.
We found no main effects of education or sex on CSF biomarkers, nor did we find clear differences in these effects by APOE genotype. While there was some indication that the men had lower Aβ42 than women in APOE ε4 carriers but had higher Aβ42 than women in noncarriers, this difference was not statistically significant and should be interpreted with great caution. The effect of the APOE ε4 genotype on AD with dementia may be larger in women than in men,45 although more recent evidence suggests increased AD with dementia risk in women is restricted to younger ages.46 Theoretically, a discrepancy between increased AD with dementia risk in women and our results could be due to a larger conversion rate to AD dementia in women vs men, which could have resulted in fewer women with high amyloid burden (i.e., lower CSF Aβ42) among APOE ε4 carriers in our CU/MCI cohort.47 Our results are in line with prior imaging-based results in the MCSA and a multicohort study regarding CSF biomarkers in CU where sex or education had no effect on biomarkers.2,48 Two other studies did find sex-related differences in the effect of APOE ε4 carriership on CSF biomarkers.4,10 The first was a study in a smaller sample, which found a 3-way interaction among age, APOE genotype, and sex for CSF Aβ42.4 A recent multicohort study found a stronger effect of the APOE ε4 allele on CSF tau in women compared to men.10 Post hoc analysis revealed this sex-specific APOE ε4 effect was only present in participants with abnormal amyloid.
Our global measure of vascular health was not associated with any of the CSF biomarkers. This is consistent with imaging evidence from the MCSA, in which Vemuri et al.22 showed that vascular health was not associated with amyloid deposition in the brain, while it was associated with evidence of neurodegeneration. In contrast, midlife vascular risk was previously found to be a risk factor for amyloid deposition.49 In a population with a Clinical Dementia Rating score of 0 from the Knight Alzheimer's Disease Research Center, vascular risk factors were associated with (longitudinal change in) CSF (t/p)-tau in participants with biological AD. The authors found no association between vascular risk and CSF Aβ42.50
An important strength of the current study is its population-based nature and the fact that we adjusted our data for participation bias, although this adjustment hardly changed results. We used a well-validated automated platform to analyze CSF, using 1 reagent lot for all biomarkers.35 A limitation of the study includes the relatively small number of participants with MCI, especially after stratification for APOE genotype, resulting in larger confidence intervals in APOE ε4 carriers when looking at the effect of clinical diagnosis.
Glossary
- Aβ42
β-amyloid 42
- AD
Alzheimer disease
- CAD
coronary artery disease
- CI
confidence interval
- CMC
cardiovascular and metabolic conditions
- CU
cognitively unimpaired
- ICD-10
International Classification of Diseases–10
- IPW
inverse probability weight
- IQR
interquartile range
- MCI
mild cognitive impairment
- MCSA
Mayo Clinic Study of Aging
- OR
odds ratio
- p-tau
hyperphosphorylated tau
- PiB
Pittsburgh compound B
- SUVR
standardized uptake value ratio
- t-tau
total tau
- WAIS-R
Wechsler Adult Intelligence Scale–Revised
- WMS-R
Wechsler Memory Scale–Revised
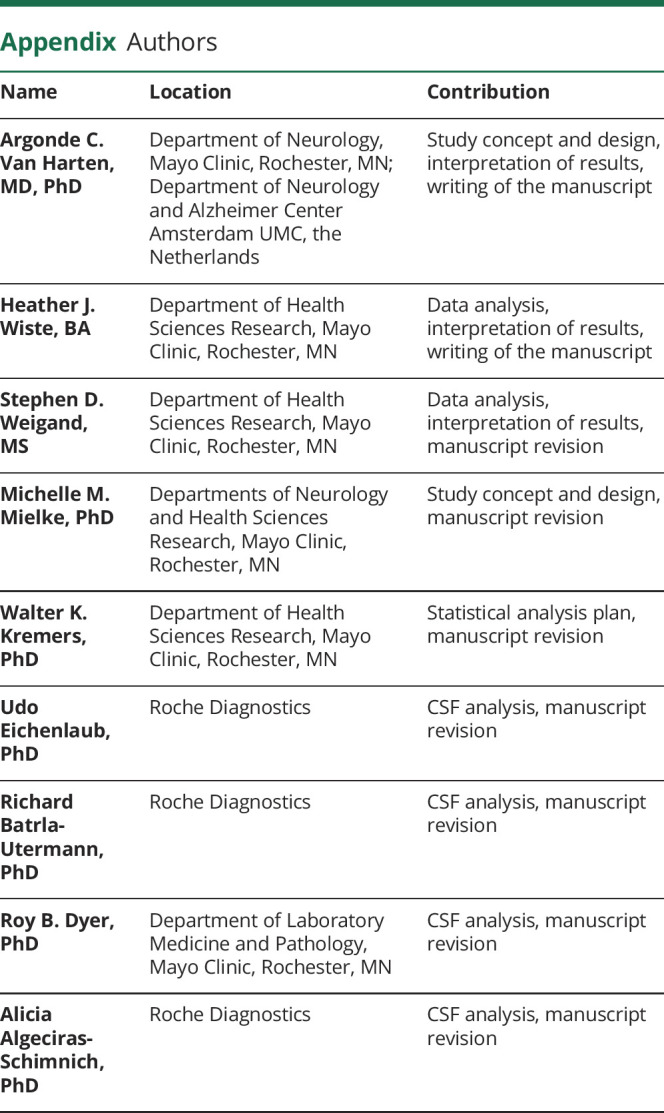
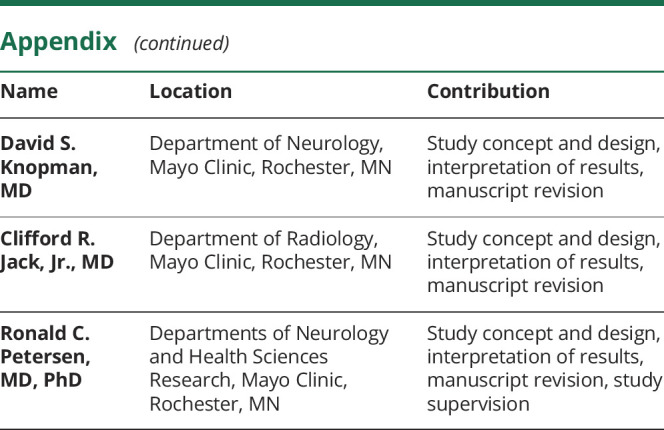
Appendix. Authors
Study funding
NIA: U01 AG006786, P50 AG016574, GHR Foundation, Mayo Foundation for Medical Education and Research.
Disclosure
A.C. van Harten served as a consultant for Roche Diagnostics. H.J. Wiste and S.D. Weigand report no disclosures relevant to the manuscript. M.M. Mielke served as a consultant to Eli Lilly and Lysosomal Therapeutics, Inc. She receives research support from the NIH (R01 AG49704, P50 AG44170, U01 AG06786, RF1 AG55151), Department of Defense (W81XWH-15-1), and unrestricted research grants from Biogen, Roche, and Lundbeck. W.K. Kremers reports no disclosures relevant to the manuscript. U. Eichenlaub is an employee of Roche Diagnostics R. Batrla-Utermann is an employee of Roche Diagnostics. R.B. Dyer and A. Algeciras-Schimnich report no disclosures relevant to the manuscript. D.S. Knopman serves on a Data Safety Monitoring Board for Lundbeck Pharmaceuticals and for the DIAN study; is an investigator in clinical trials sponsored by Biogen, Lilly Pharmaceuticals, and the Alzheimer's Disease Cooperative Study; and receives research support from the NIH. C.R. Jack Jr. has provided consulting services for Eli Lilly Co. He receives research funding from the NIH (R01 AG011378, U01 HL096917, U01 AG024904, RO1 AG041851, R01 AG037551, R01 AG043392, U01 AG006786) and the Alexander Family Alzheimer's Disease Research Professorship of the Mayo Foundation. R.C. Petersen is a consultant for Roche, Inc., Merck, Inc., Biogen, Inc., Genentech, Inc. Eisai, Inc., and GE Healthcare. Go to Neurology.org/N for full disclosures.
References
- 1.Jack CR, Bennett DA, Blennow K, et al. NIA-AA Research Framework: toward a biological definition of Alzheimer's disease. Alzheimers Dement 2018;14:535–562. [DOI] [PMC free article] [PubMed] [Google Scholar]
- 2.Toledo JB, Zetterberg H, van Harten AC, et al. Alzheimer's disease cerebrospinal fluid biomarker in cognitively normal subjects. Brain 2015;138:2701–2715. [DOI] [PMC free article] [PubMed] [Google Scholar]
- 3.Glodzik-Sobanska L, Pirraglia E, Brys M, et al. The effects of normal aging and ApoE genotype on the levels of CSF biomarkers for Alzheimer's disease. Neurobiol Aging 2009;30:672–681. [DOI] [PMC free article] [PubMed] [Google Scholar]
- 4.Li G, Shofer JB, Petrie EC, et al. Cerebrospinal fluid biomarkers for Alzheimer's and vascular disease vary by age, gender, and APOE genotype in cognitively normal adults. Alzheimers Res Ther 2017;9:48. [DOI] [PMC free article] [PubMed] [Google Scholar]
- 5.Liu Y, Tan L, Wang HF, et al. Multiple effect of APOE genotype on clinical and neuroimaging biomarkers across Alzheimer's disease spectrum. Mol Neurobiol 2016;53:4539–4547. [DOI] [PubMed] [Google Scholar]
- 6.Paternicò D, Galluzzi S, Drago V, et al. . Cerebrospinal fluid markers for Alzheimer's disease in a cognitively healthy cohort of young and old adults. Alzheimers Dement 2012;8:520–527. [DOI] [PubMed] [Google Scholar]
- 7.Popp J, Lewczuk P, Frommann I, et al. Cerebrospinal fluid markers for Alzheimer's disease over the lifespan: effects of age and the APOEε4 genotype. J Alzheimers Dis 2010;22:459–468. [DOI] [PubMed] [Google Scholar]
- 8.Resnick SM, Bilgel M, Moghekar A, et al. Changes in Aβ biomarkers and associations with APOE genotype in 2 longitudinal cohorts. Neurobiol Aging 2015;36:2333–2339. [DOI] [PMC free article] [PubMed] [Google Scholar]
- 9.Sutphen CL, Jasielec MS, Shah AR, et al. Longitudinal cerebrospinal fluid biomarker changes in preclinical Alzheimer disease during middle age. JAMA Neurol 2015;72:1029–1042. [DOI] [PMC free article] [PubMed] [Google Scholar]
- 10.Hohman TJ, Dumitrescu L, Barnes LL, et al. Sex-specific association of apolipoprotein E with cerebrospinal fluid levels of tau. JAMA Neurol 2018;75:989–998. [DOI] [PMC free article] [PubMed] [Google Scholar]
- 11.Mattsson N, Andreasson U, Persson S, et al. CSF biomarker variability in the Alzheimer's Association quality control program. Alzheimers Dement 2013;9:251–261. [DOI] [PMC free article] [PubMed] [Google Scholar]
- 12.Petersen RC, Roberts RO, Knopman DS, et al. Prevalence of mild cognitive impairment is higher in men: The Mayo Clinic Study of Aging. Neurology 2010;75:889–897. [DOI] [PMC free article] [PubMed] [Google Scholar]
- 13.Roberts RO, Geda YE, Knopman DS, et al. The Mayo Clinic Study of Aging: design and sampling, participation, baseline measures and sample characteristics. Neuroepidemiology 2008;30:58–69. [DOI] [PMC free article] [PubMed] [Google Scholar]
- 14.St Sauver JL, Grossardt BR, Yawn BP, et al. Data resource profile: the Rochester Epidemiology Project (REP) medical records-linkage system. Int J Epidemiol 2012;41:1614–1624. [DOI] [PMC free article] [PubMed] [Google Scholar]
- 15.Reitan RM. Validity of the Trail Making Test as indicator of organic brain damage. Percept Mot Skills 1958;8:271–276. [Google Scholar]
- 16.Wechsler D. WAIS-R Manual: Wechsler Adult Intelligence Scale–Revised. San Antonio: Psychological Corp; 1981. [Google Scholar]
- 17.Lucas JA, Ivnik RJ, Smith GE, et al. Mayo's older Americans normative studies: category fluency norms. J Clin Exp Neuropsychol 1998;20:194–200. [DOI] [PubMed] [Google Scholar]
- 18.Kaplan EF, Goodglass H, Weintraub S. Boston Naming Test. Philadelphia: Lea & Febiger; 1978. [Google Scholar]
- 19.Wechsler DA. Wechsler Memory Scale–Revised. San Antonio:Psychological Corp; 1987. [Google Scholar]
- 20.Ivnik RJ, Malec JF, Smith GE, et al. Mayo's older Americans normative studies: WAIS-R norms for ages 56 to 97. Clin Neuropsychol 1992;6:1–30. [Google Scholar]
- 21.Petersen RC. Mild cognitive impairment as a diagnostic entity. J Intern Med 2004;256:183–194. [DOI] [PubMed] [Google Scholar]
- 22.Vemuri P, Lesnick TG, Przybelski SA, et al. Age, vascular health, and Alzheimer disease biomarkers in an elderly sample. Ann Neurol 2017;82:706–718. [DOI] [PMC free article] [PubMed] [Google Scholar]
- 23.Senjem ML, Gunter JL, Shiung MM, Petersen RC, Jack CR. Comparison of different methodological implementations of voxel-based morphometry in neurodegenerative disease. Neuroimage 2005;26:600–608. [DOI] [PMC free article] [PubMed] [Google Scholar]
- 24.Jack CR, Wiste HJ, Therneau TM, et al. Associations of amyloid, tau, and neurodegeneration biomarker profiles with rates of memory decline among individuals without dementia. JAMA 2019;321:2316–2325. [DOI] [PMC free article] [PubMed] [Google Scholar]
- 25.Jack CR, Wiste HJ, Weigand SD, et al. Defining imaging biomarker cut points for brain aging and Alzheimer's disease. Alzheimers Dement 2017;13:205–216. [DOI] [PMC free article] [PubMed] [Google Scholar]
- 26.Scrucca L, Fop M, Murphy TB, Raftery AE. Mclust 5: clustering, classification and density estimation using Gaussian finite mixture models. R J 2016;8:289–317. [PMC free article] [PubMed] [Google Scholar]
- 27.Mulder C, Verwey A, van der Flier M, et al. Amyloid-β(1-42), total tau, and phosphorylated tau as cerebrospinal fluid biomarkers for the diagnosis of Alzheimer disease. Clin Chem 2010;56:248–253. [DOI] [PubMed] [Google Scholar]
- 28.de Leon MJ, Pirraglia E, Osorio RS, et al. The nonlinear relationship between cerebrospinal fluid Aβ42 and tau in preclinical Alzheimer's disease. PLoS One 2018;13:e0191240. [DOI] [PMC free article] [PubMed] [Google Scholar]
- 29.van Harten AC, Mulders J, Scheltens P, van der Flier WM, Oudejans CB. Differential expression of microRNA in cerebrospinal fluid as a potential novel biomarker for Alzheimer's disease. J Alzheimers Dis 2015;47:243–252. [DOI] [PubMed] [Google Scholar]
- 30.Chen CP, Chen RL, Preston JE. The influence of ageing in the cerebrospinal fluid concentrations of proteins that are derived from the choroid plexus, brain, and plasma. Exp Gerontol 2012;47:323–328. [DOI] [PubMed] [Google Scholar]
- 31.Masseguin C, LePanse S, Corman B, Verbavatz JM, Gabrion J. Aging affects choroidal proteins involved in CSF production in Sprague-Dawley rats. Neurobiol Aging 2005;26:917–927. [DOI] [PubMed] [Google Scholar]
- 32.Chiu C, Miller MC, Caralopoulos IN, et al. Temporal course of cerebrospinal fluid dynamics and amyloid accumulation in the aging rat brain from three to thirty months. Fluids Barriers CNS 2012;9:3. [DOI] [PMC free article] [PubMed] [Google Scholar]
- 33.Besser LM, Alosco ML, Ramirez Gomez L, et al. Late-life vascular risk factors and alzheimer disease neuropathology in individuals with normal cognition. J Neuropathol Exp Neurol 2016;75:955–962. [DOI] [PMC free article] [PubMed] [Google Scholar]
- 34.Shaw LM, Walingorska T, Fields L, et al. Derivation of cutoffs for the Elecsys amyloid beta (1-42) assay in Alzheimer's disease. Alzheimers Dement 2018;11:698–705. [DOI] [PMC free article] [PubMed] [Google Scholar]
- 35.Schindler SE, Gray JD, Gordon BA, et al. Cerebrospinal fluid biomarkers measured by Elecsys assays compared to amyloid imaging. Alzheimers Dement 2018;14:1460–1469. [DOI] [PMC free article] [PubMed] [Google Scholar]
- 36.Hansson O, Lehmann S, Otto M, Zetterberg H, Lewczuk P. Advantages and disadvantages of the use of the CSF Amyloid β (Aβ) 42/40 ratio in the diagnosis of Alzheimer's disease. Alzheimers Res Ther 2019;11:34. [DOI] [PMC free article] [PubMed] [Google Scholar]
- 37.Jack CR, Bennett DA, Blennow K, et al. A/T/N: an unbiased descriptive classification scheme for Alzheimer disease biomarkers. Neurology 2016;87:539–547. [DOI] [PMC free article] [PubMed] [Google Scholar]
- 38.Jansen WJ, Ossenkoppele R, Knol DL, et al. Prevalence of cerebral amyloid pathology in persons without dementia: a meta-analysis. JAMA 2015;313:1924–1938. [DOI] [PMC free article] [PubMed] [Google Scholar]
- 39.Roberts RO, Knopman DS, Syrjanen JA, et al. Weighting and standardization of frequencies to determine prevalence of AD imaging biomarkers. Neurology 2017;89:2039–2048. [DOI] [PMC free article] [PubMed] [Google Scholar]
- 40.Jack CR, Wiste HJ, Weigand SD, et al. Age, sex, and APOE ε4 effects on memory, brain structure, and β-amyloid across the adult life span. JAMA Neurol 2015;72:511–519. [DOI] [PMC free article] [PubMed] [Google Scholar]
- 41.Risacher SL, Kim S, Nho K, et al. APOE effect on Alzheimer's disease biomarkers in older adults with significant memory concern. Alzheimers Dement 2015;11:1417–1429. [DOI] [PMC free article] [PubMed] [Google Scholar]
- 42.Patterson BW, Elbert DL, Mawuenyega KG, et al. Age and amyloid effects on human central nervous system amyloid-beta kinetics. Ann Neurol 2015;78:439–453. [DOI] [PMC free article] [PubMed] [Google Scholar]
- 43.Mattsson N, Insel PS, Donohue M, et al. Independent information from cerebrospinal fluid amyloid-β and florbetapir imaging in Alzheimer's disease. Brain 2015;138:772–783. [DOI] [PMC free article] [PubMed] [Google Scholar]
- 44.Jack CR, Knopman DS, Jagust WJ, et al. Tracking pathophysiological processes in Alzheimer's disease: an updated hypothetical model of dynamic biomarkers. Lancet Neurol 2013;12:207–216. [DOI] [PMC free article] [PubMed] [Google Scholar]
- 45.Rocca WA, Mielke MM, Vemuri P, Miller VM. Sex and gender differences in the causes of dementia: a narrative review. Maturitas 2014;79:196–201. [DOI] [PMC free article] [PubMed] [Google Scholar]
- 46.Neu SC, Pa J, Kukull W, et al. Apolipoprotein E genotype and sex risk factors for alzheimer disease: a meta-analysis. JAMA Neurol 2017;74:1178–1189. [DOI] [PMC free article] [PubMed] [Google Scholar]
- 47.Mattsson N, Groot C, Jansen WJ, et al. Prevalence of the apolipoprotein E ε4 allele in amyloid β positive subjects across the spectrum of Alzheimer's disease. Alzheimers Dement 2018;14:913–924. [DOI] [PubMed] [Google Scholar]
- 48.Jack CR, Wiste HJ, Weigand SD, et al. Age-specific and sex-specific prevalence of cerebral β-amyloidosis, tauopathy, and neurodegeneration in cognitively unimpaired individuals aged 50-95 years: a cross-sectional study. Lancet Neurol 2017;16:435–444. [DOI] [PMC free article] [PubMed] [Google Scholar]
- 49.Gottesman RF, Schneider AL, Zhou Y, et al. Association between midlife vascular risk factors and estimated brain amyloid deposition. JAMA 2017;317:1443–1450. [DOI] [PMC free article] [PubMed] [Google Scholar]
- 50.Bos I, Vos SJB, Schindler SE, et al. Vascular risk factors are associated with longitudinal changes in cerebrospinal fluid tau markers and cognition in preclinical Alzheimer's disease. Alzheimers Dement 2019;15:1149–1159. [DOI] [PMC free article] [PubMed] [Google Scholar]
Associated Data
This section collects any data citations, data availability statements, or supplementary materials included in this article.
Data Availability Statement
Data will be shared by request from a qualified investigator in accordance with the MCSA data-sharing protocol.


