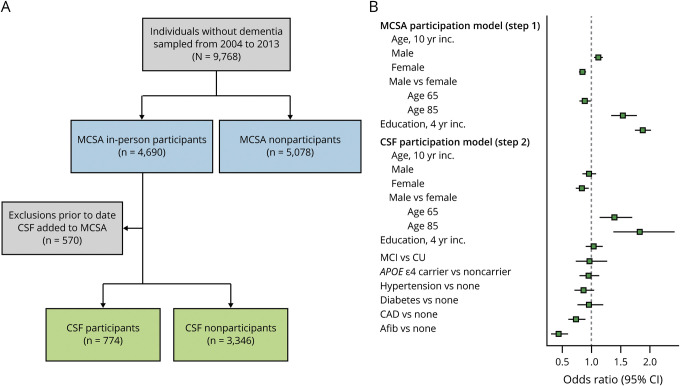
Figure 1. Flow chart of the study design and summary of participation models.
(A) Flow chart detailing the study design. The blue boxes enumerate in-person participation in the Mayo Clinic Study of Aging (MCSA) vs nonparticipation. The nonparticipants include 1,815 individuals who participated by telephone only and 3,263 who refused to participate. (B) Summary of logistic regression models used for inverse probability weighting to account for potential participation bias. The green points in step one show the odds ratios (95% confidence interval [CI]) for variables in the MCSA participation model. The green points in step 2 show the odds ratios (95% CI) for variables in the CSF participation model. A total of 570 individuals who participated in the MCSA progressed to dementia, died, or were lost to follow-up prior to the start of CSF inclusion in November 2007. Afib = atrial fibrillation; CAD = coronary artery disease; CI = confidence interval; CU = cognitively unimpaired; MCI = mild cognitive impairment.

