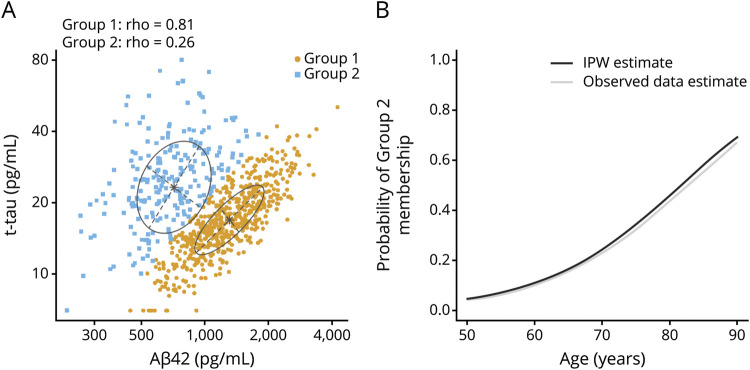
Figure 3. Bivariate mixture model of CSF hyperphosphorylated tau (p-tau) and β-amyloid 42 (Aβ42).
(A) Scatterplot of CSF p-tau vs Aβ42 with classification of individuals into 2 groups defined using a bivariate mixture model (gold points for group 1 and blue for group 2). (B) Estimated probability of group 2 membership vs age after inverse probability weighting (IPW) to adjust for potential participation bias (black). Unweighted estimates from the observed data are shown in gray. Group 2 is presumed to represent a latent group with biological Alzheimer disease. t-tau = total tau.

