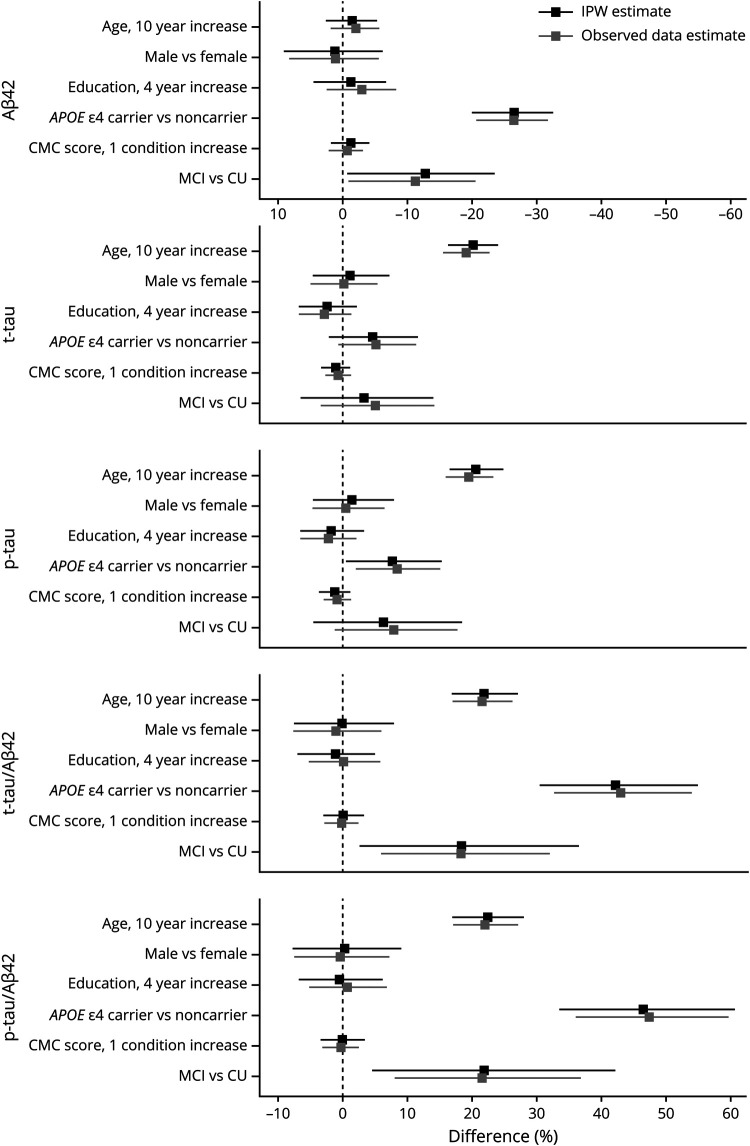
Figure 4. CSF associations with age, sex, education, APOE genotype, vascular risk, and clinical diagnosis.
The estimated mean % difference (95% confidence interval) in CSF measures are shown for different covariate contrasts. Estimates are from linear regression models (separate models for each CSF outcome) with age, sex, education, APOE genotype, and clinical diagnosis as additive effects. Inverse probability weighted (IPW) estimates account for potential participation bias. Aβ42 = β-amyloid 42; CMC = cardiovascular and metabolic conditions; CU = cognitively unimpaired; MCI = mild cognitive impairment; p-tau = hyperphosphorylated tau; t-tau = total tau.

