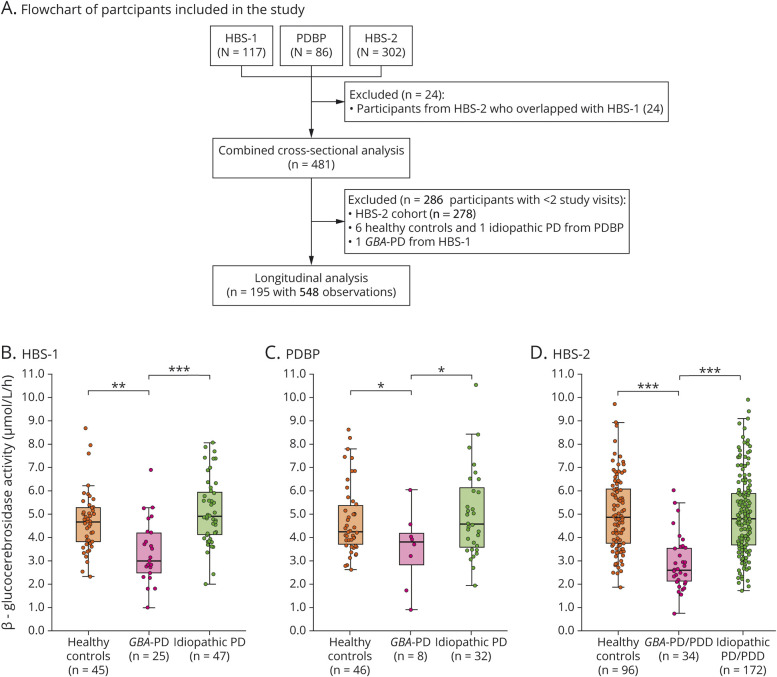
Figure 1. Flowchart of study participants and β-glucocerebrosidase activity in blood of patients with Parkinson disease (PD) with a GBA mutation (GBA-PD) compared to healthy controls and patients with idiopathic PD.
(A) Flowchart of study participants. (B–D) β-glucocerebrosidase activity in blood of patients with GBA-PD compared to healthy controls and patients with idiopathic PD. Results are shown for (B) the Harvard Biomarkers Study cohort 1 (HBS-1), (C) the National Institute of Neurological Disorders and Stroke Parkinson's Disease Biomarkers Program (PDBP) cohort, and (D) the Harvard Biomarkers Study cohort 2 (HBS-2). Unadjusted β-glucocerebrosidase activity values are shown in box and jitter dot blots; box plots indicate the median (bold line), the 25th and 75th percentiles (box edges), and the most extreme data point no more than 1.5x the interquartile range from the box (whiskers). The p values are shown for the comparison of patients with GBA-PD to healthy controls and patients with idiopathic PD, respectively, from generalized linear mixed model analyses adjusting for age, sex, duration of sample storage, and assay batch (B and C) and in addition to body mass index (D). PDD = Parkinson disease with dementia.

