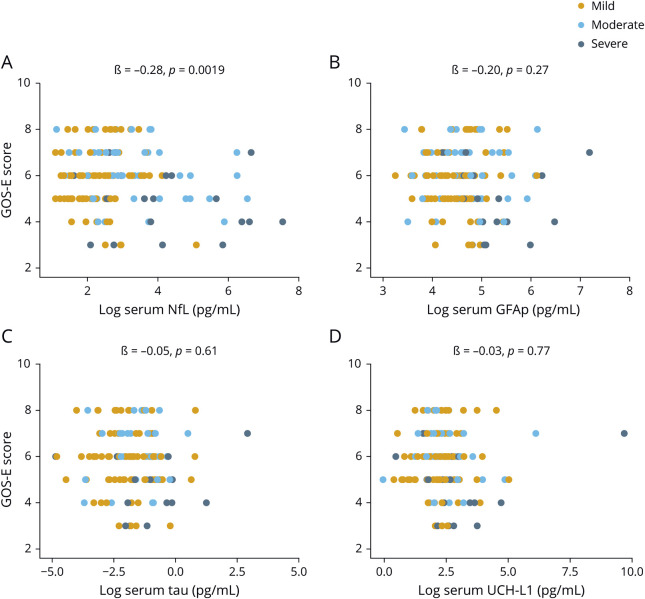
Figure 4. Association between blood biomarkers and functional outcome at enrollment.
(A–D) Association between concentrations of neurofilament light (NfL), glial fibrillary acidic protein (GFAP), tau, and ubiquitin C-terminal hydrolase-L1(UCH-L1) at enrollment and Glasgow Outcome Scale–Extended (GOS-E) assessed cross-sectionally. The x-axes show the log-transformed values for visual clarity. The ß estimates and p values are from linear regression models, covaried for age, education, and sex.

