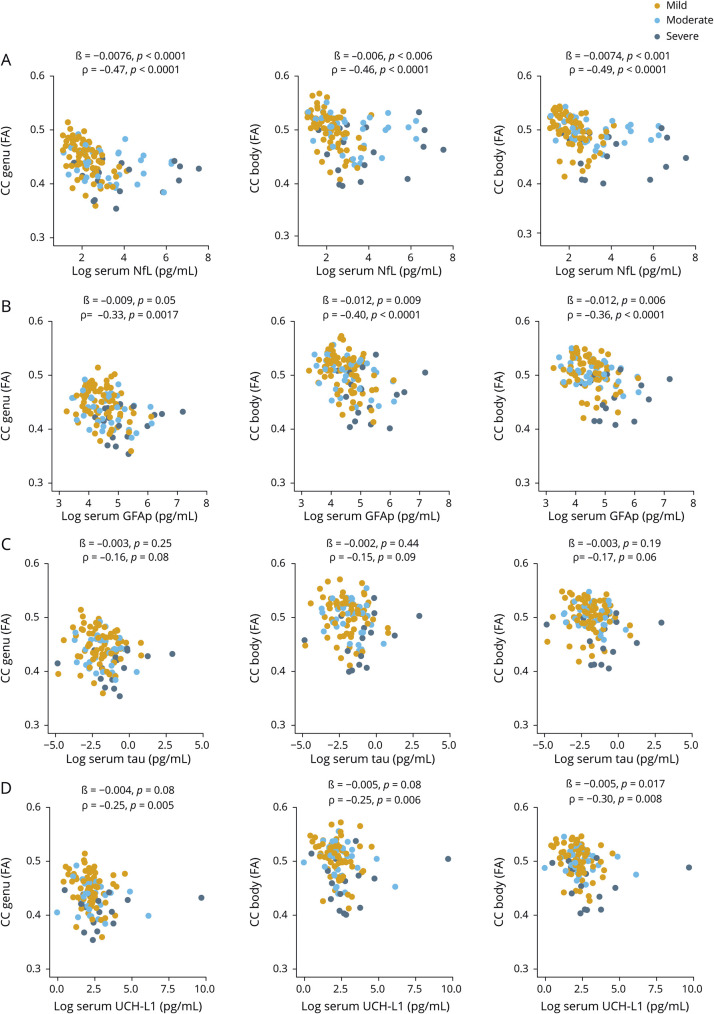
Figure 6. Serum biomarkers at enrollment in relation to DTI fractional anisotropy.
(A–D) Relationship between serum neurofilament light (NfL), glial fibrillary acidic protein (GFAP), tau, and ubiquitin C-terminal hydrolase-L1 (UCH-L1) measured at enrollment and diffusion tensor imaging (DTI) fractional anisotropy (FA) for corpus callosum (CC) integrity measured at enrollment. The ß estimates and p values are from regression models, covaried for age, education, and sex. We also assessed the relationship with univariate the Spearman rank correlation (ρ).

