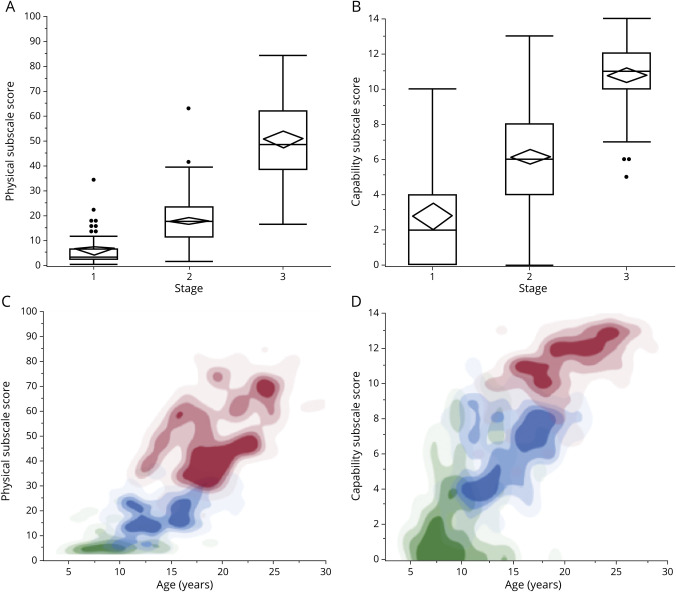
Figure 2. Relationships among UBDRS subscale severity scores, CLN3 Staging System stages, and participant age.
Distributions of Unified Batten Disease Rating Scale (UBDRS) (A) Physical and (B) capability subscale scores for each of the stages. Mean severity scores and 95% confidence intervals are represented by diamonds; median, quartiles, and range are represented by box-and-whisker plots. Individual points represent outliers, which are >1.5 times the interquartile range above the third quartile or below the first. (A) t Tests showed significant differences between stages (stage 1 vs 2: t = 7.1, p < 0.0001; stage 2 vs 3: t = 24.4, p < 0.0001; stage 1 vs 3: t = 22.7, p < 0.0001). (B) t Tests showed significant differences between stages (stage 1 vs 2: t = 9.4, p < 0.0001; stage 2 vs 3: t = 20.2, p < 0.0001; stage 1 vs 3: t = 14.6, p < 0.0001). Data density contour plots, by stage, of relationship between age and severity for UBDRS (C) Physical and (D) Capability subscale scores. Stage 1 data are represented in green; stage 2, in blue; and stage 3, in red. Data density is represented by color density.

