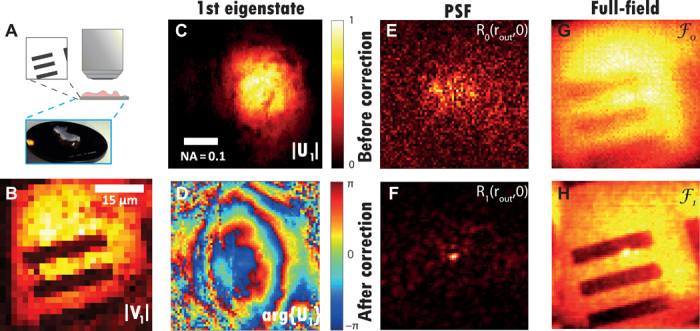
Fig. 3. Imaging through a thick layer of rat intestinal tissue.

(A) Experimental configuration. (B and C) Modulus of the first input singular vector V1 of D in the focal plane. (D) Modulus and phase of the first output singular vector Up in the pupil plane. (E) Example of PSF deduced from the central column (rin = 0) of the raw focused matrix R0. (F) Corresponding corrected PSF deduced from the central column of the focused matrix R1 (Eq. 12). (G and H) Comparison of the full-field images ℱ0 and ℱ1 (Eq. 14) before and after aberration correction. Photo credit: Amaury Badon, CNRS.
