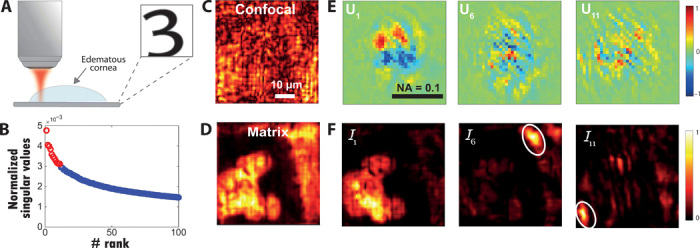
Fig. 5. Imaging through corneal tissue with deteriorated transparency.

(A) Schematic of the experiment. A resolution target (USAF 1951) is positioned below an edematous nonhuman primate cornea (see inset). (B) Plot of the normalized singular values of D. The red circles correspond to the 11 first singular values (signal subspace), while the noisy singular values are displayed in blue. (C) Original confocal image deduced from the focused reflection matrix R0 (Eq. 18). (D) Final matrix image constructed from the 11 first eigenstates of D (Eq. 20). (E) Real parts of U1, U6, and U11. (F) Corresponding confocal images deduced from the focused reflection matrices Rp (Eq. 18).
