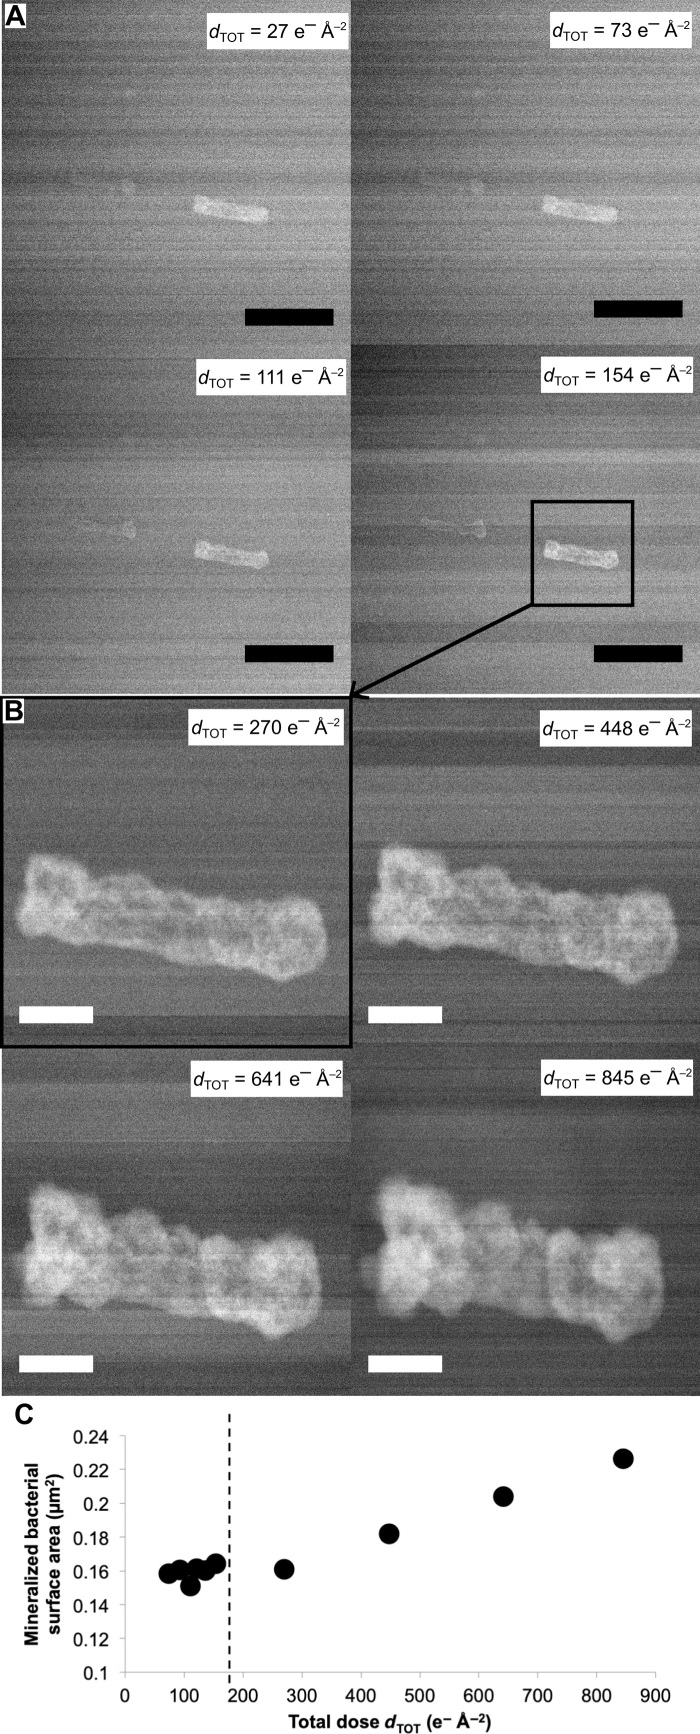
Fig. 1. In situ monitoring of Mn bacterial mineralization.
(A) Time series of LC-STEM images acquired with a continuous electron dose rate of 0.30 e− Å−2 s−1 on a cell of E. coli MGF bathed in an aqueous solution containing Mn. Scale bars, 1 μm. (B) Time series of LC-STEM images of the same cell subsequently irradiated with a continuous electron dose rate of 5.23 e− Å−2 s−1 at increased magnification. Scale bars, 200 nm. dTOT is the cumulative electron dose in e− Å−2 calculated for each image. (C) Mineralized bacterial cell surface area as a function of cumulative electron dose. Dashed line indicates the change in magnification (i.e., increase in the dose rate).

