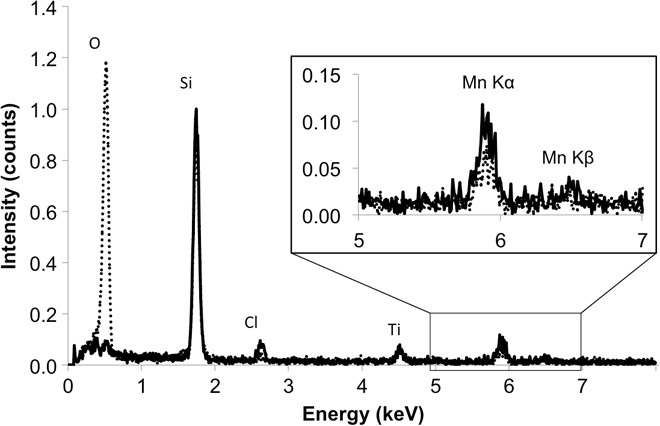
Fig. 3. STEM-EDXS characterization of the mineral crusts formed on the bacterial cell wall.

Solid line spectrum is the signal obtained with the electron probe on the mineralized bacteria E. coli MGF, and dashed spectrum corresponds to the signal obtained in the surrounding aqueous solution. The strong oxygen signal in the latter likely relates to water.
