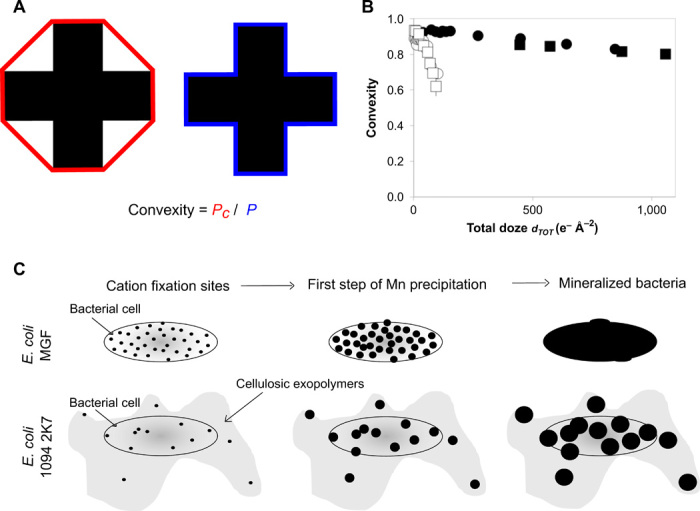
Fig. 4. Contrasted nucleation and growth mechanisms of Mn precipitates as a function of bacterial exopolymers.

(A) Schematic representation of convexity. It corresponds to the ratio between effective perimeter (P, in blue) and convex perimeter (Pc, in red) of a 2D shape. (B) Convexity of mineralized bacterial cells and their exopolymers as a function of the cumulative electron dose. Black squares and circles were obtained from two duplicate measurements on individual E. coli MGF cells (Fig. 1 and fig. S2A). White squares and circles were obtained from two duplicate measurements on individual E. coli 2K7 cells (Fig. 2 and fig. S2B). (C) Schematic representation of mineral formation for both strains. Black circles depict Mn precipitates.
