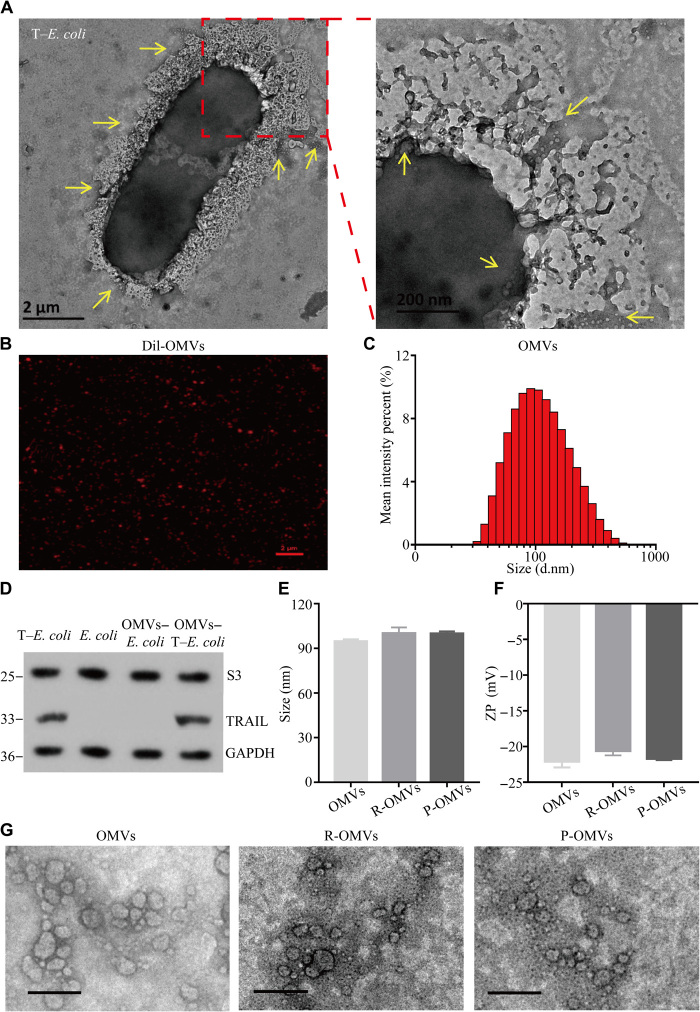
Fig. 2. Construction and characterization of I-P-OMVs.
(A) TEM images of T–E. coli with their derived OMVs. Scale bars, 2 μm and 200 nm. (B) Confocal laser scanning microscopy (CLSM) image of Dil-OMVs. Scale bar, 2 μm. (C) Size distribution of OMVs measured by DLS. (D) WB analysis of S3 protein (a classical protein contained within E. coli) and TRAIL protein in bacterial cells and their derived OMVs. GAPDH, glyceraldehyde-3-phosphate dehydrogenase. (E) Size distribution and (F) zeta potential (ZP) of OMVs, R-OMVs, and P-OMVs. (G) TEM images of OMVs, R-OMVs, and P-OMVs. Scale bars, 200 nm.

