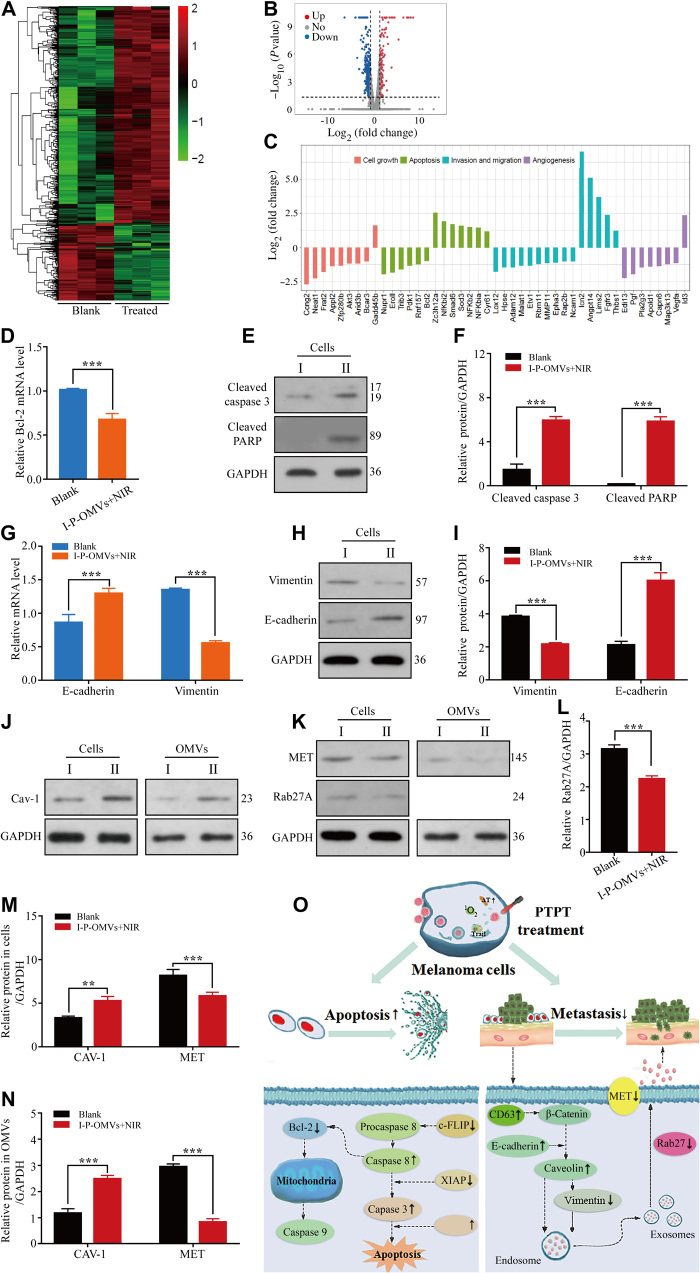
Fig. 5. Cells genetic and proteic alterations in response to I-P-OMVs+NIR.
(A and B) Hierarchical clustering (A) and volcano plots (B) of differentially regulated genes identified at q < 0.05 in B16F10 cells. (C) Categorization of the differentially expressed genes. (D) Bcl-2 gene in the tested B16F10 cells (n = 3). (E and F) WB (E) and pooled data (F) of cleaved caspase 3 and cleaved PARP protein levels in the tested B16F10 cells (n = 3). (G) E-cadherin and vimentin genes in the tested B16F10 cells. (H and I) WB (H) and pooled data (I) of the E-cadherin and vimentin protein levels in the tested B16F10 cells (n = 3). (J) WB of Caveolin-1 (Cav-1) protein level in the tested cells or their derived OMVs (n = 3). (K) WB of mesenchymal-to-epithelial transition (MET) and Rab27A proteins level in the tested cells or their derived OMVs (n = 3). (L to N) Pooled data of Rab27A (L), Cav-1, and MET (M and N) protein levels in the tested cells or their derived OMVs (n = 3). I and II represent the blank and I-P-OMVs+NIR groups, respectively. All blank groups indicate cells treated by culture medium. (O) Schematic illustration of the changes in apoptosis and metastasis related genes upon I-P-OMVs+NIR. All data are represented as means ± SD. ***P < 0.001 and **P < 0.01.

