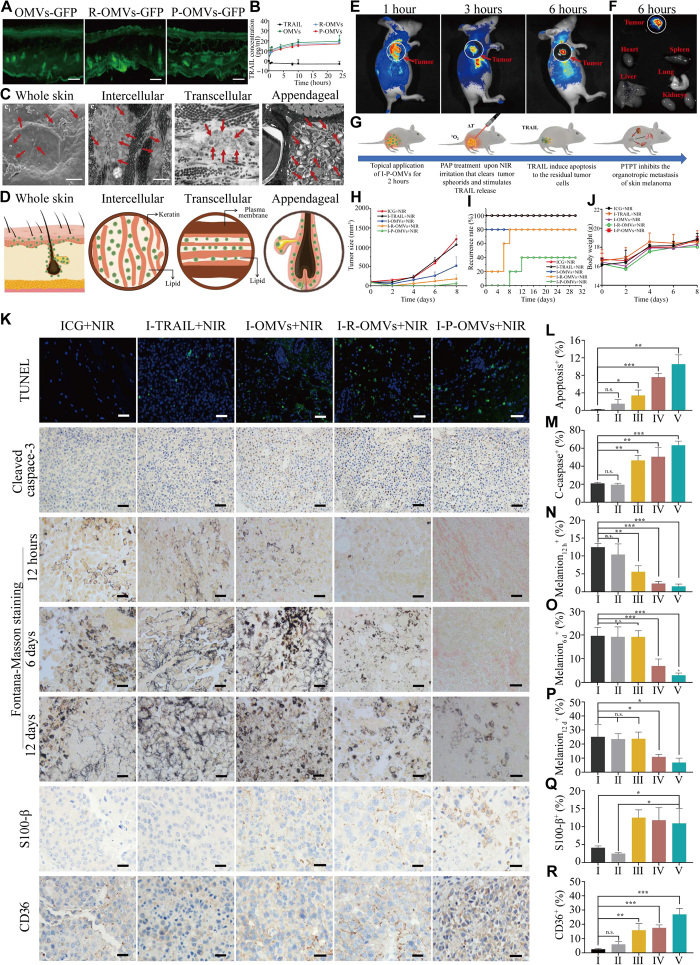
Fig. 6. Transdermal delivery of I-P-OMVs and antitumor performance of I-P-OMVs+NIR.
(A) The distribution of OMVs-GFP, R-OMVs-GFP, and P-OMVs-GFP in skin slice. Scale bars, 100 nm. (B) The accumulative transdermal amounts of TRAIL protein (n = 3). (C) Scanning electron microscopy (SEM) (c1) and TEM (c2, c3, and c4) images of skin tissues after topical application of DiI-P-OMVs. Scale bars, 1 μm. DiI (1,1′-dioctadecyl-3,3,3′,3′-tetramethylindocarbocyanine perchlorate)–P-OMVs were indicated by red arrows. (D) Schematic illustration of the distribution of OMVs in skin and their transdermal routes. (E) In vivo fluorescence imaging of tumor-bearing mice after topically applied with Dil-P-OMVs. (F) Fluorescent images of tumors and major organs (G) Therapeutic regimen of I-P-OMVs+NIR in mice with B16F10 melanoma. (H to J) The tumors size, relapse rates, and body weights in mice during tested periods. (K) The TUNEL (terminal deoxynucleotidyl transferase–mediated deoxyuridine triphosphate nick end labeling), cleaved caspase 3, Fontana-Masson (12 hours, day 6, and day 12), S100-β (day 12), and CD63 (day 12) staining of tumors. (L to R) Quantification of (K)-positive cells in the tumors (n = 3). Scale bars, 100 nm. I to V represent the ICG+NIR, I-TRAIL+NIR, I-OMVs+NIR, I-R-OMVs+NIR, and I-P-OMVs+NIR groups, respectively. All data are represented as means ± SD. ***P < 0.001, **P < 0.01, and *P < 0.05. n.s., not significant.

