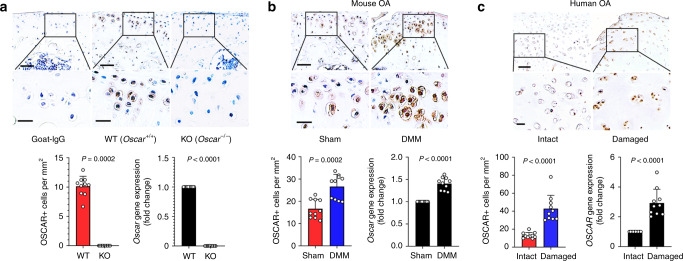
Fig. 1. OSCAR expression in mice and humans is upregulated in articular chondrocytes in OA.
a Immunostaining for OSCAR protein (top) and mRNA levels (bottom-right) in articular chondrocytes of Oscar−/− and WT mice. Error bars represent mean ± S.E.M. of n = 10 mice. Scale bar = 50 μm (top), 20 μm (bottom). b IHC (top) and qRT-PCR (bottom-right) analyses of OSCAR in articular cartilage of DMM surgery mice (compared to sham-operated mice). Error bars represent mean ± S.E.M. of n = 10 mice. Scale bar = 50 μm (top), 20 μm (bottom). c Representative images show immunostaining (top) and quantitative analyses (bottom-right) of OSCAR in intact and damaged regions of human OA articular cartilage. Error bars represent mean ± S.E.M. of n = 10 patient samples. Scale bar = 200 μm (top), 50 μm (bottom). Student’s two-tailed t test was used for statistical analysis, with p values displayed in figure.

