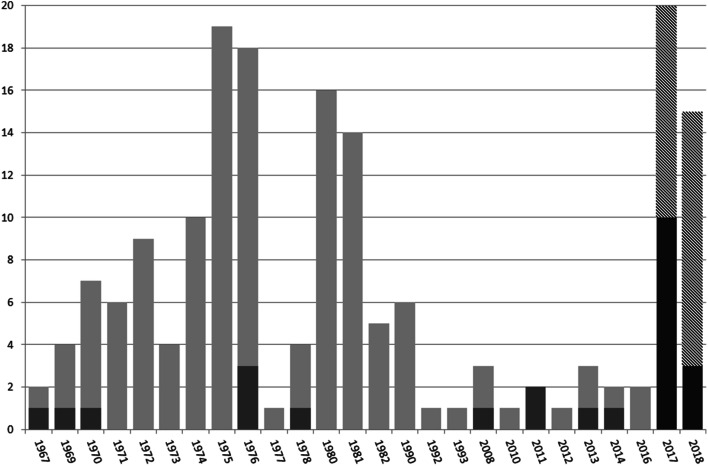
Fig. 1.
Distribution of positive and tested samples for PCV3 over 51 years (from 1967 to 2018) using the nested PCR technique. In light gray, FFPE samples tested from 1967 to 2016; in dark gray, positive samples tested from 1967 to 2016; in hatch, frozen samples tested from 2017 to 2018; and in solid black, positive samples tested from 2017 to 2018

