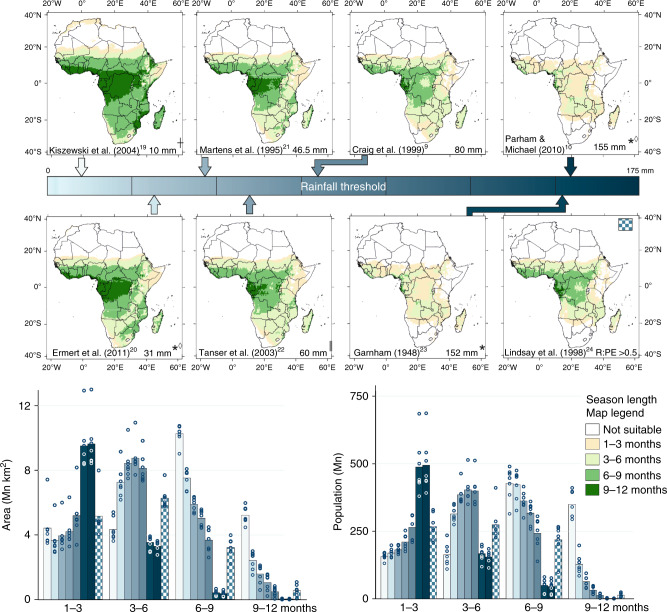
Fig. 1. The effect of rainfall threshold on estimates of climatic suitability for malaria transmission.
The estimates from eight rainfall thresholds reported in the literature (see Supplementary Table 1 for further details) combined with the Mordecai et al.8. thermal response curve for Africa over the period 1971–2005. Areas within 3-month bands are calculated for season length, with the coloured arrows locating each rainfall threshold on the linear scale bar providing a legend. Bars indicate mean of model estimates (n = 7); points indicate individual model estimates. *Originally calculated for daily (or dekadal) rainfall and scaled up for a monthly value; ││ includes a ‘catalyst month’ of 80 mm rainfall; ◊ also implements an upper rainfall threshold (Supplementary Table 1); † only for ‘temporary’ water bodies that form the breeding habitat of the Anopheles gambiae s.l. complex.

