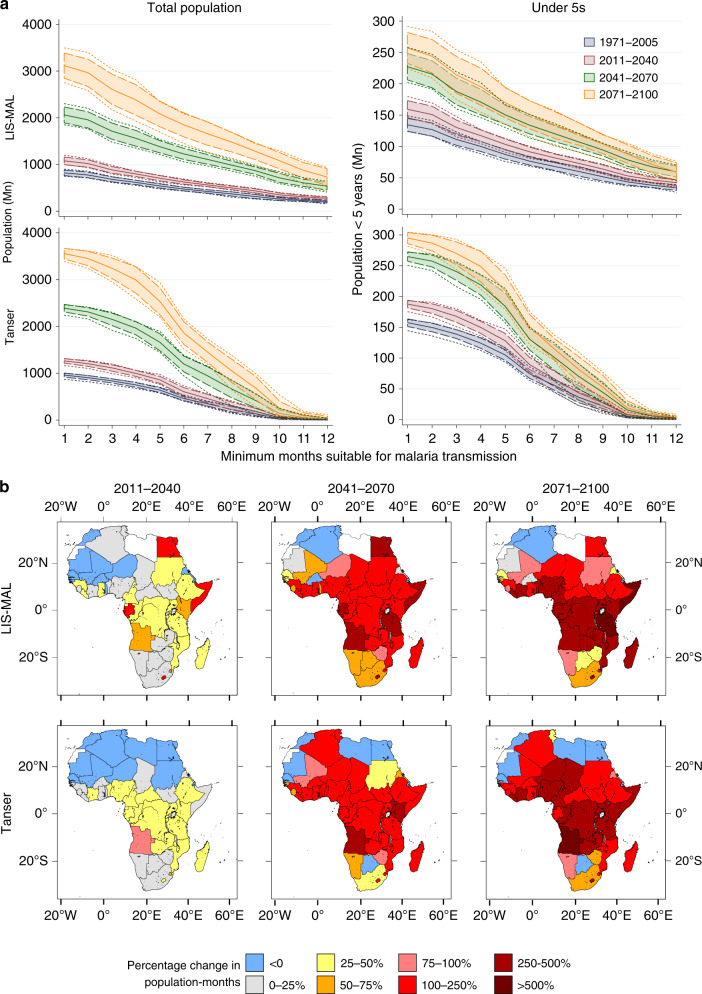
Fig. 4. Future populations in areas climatically suitable for malaria transmission.
a Populations within areas climatically suitable for malaria transmission. Solid lines show the mean of the GCM forcing models, shaded areas indicate ±1 standard deviation and dashed lines show a range of predictions. Total population and under-5s calculated for both the Tanser rainfall threshold and LIS-MAL estimates using the WorldPop gridded distributions and UN medium variant projections for each period. b Predicted percentage changes in population-months (i.e. population exposed multiplied by the number of additional months of exposure) by country. White shading indicates no estimated malaria suitability.

