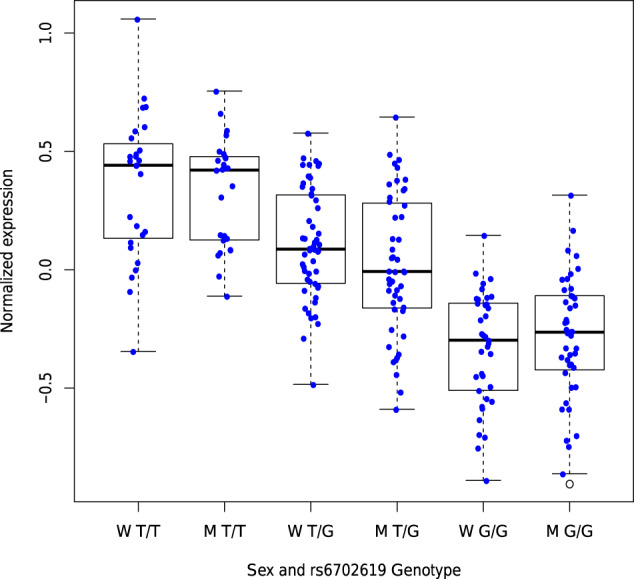
Fig. 3. PALMD expression in 233 human aortic valves.

Boxplot representing PALMD expression according to sex and rs6702619 genotype in aortic valve tissue from 117 women and 116 men with CAVS. W: Women, M: Men. “G” is the CAVS risk allele at rs6702619. Whiskers represent the most extreme data points, which are no more than 1.5 times the interquartile range. The empty circle represents an outlier data point. Box boundaries represent the first and third quartiles. The center mark represents the median. Phet = 0.36 for the effect of rs6702619 on expression between sex (Woolf’s test for heterogeneity).
