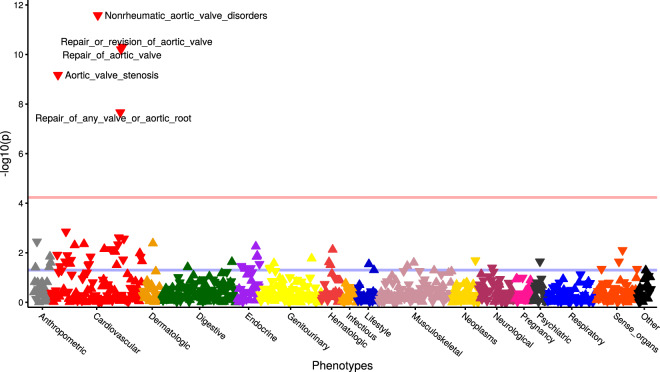
Fig. 4. PheWAS of PALMD genetically-determined expression in the aortic valve.
Each triangle represents a different phenotype in the UK Biobank (n = 852). Triangles pointing up and down are positive and negative associations with PALMD genetically-determined expression in the aortic valve, respectively. The pink horizontal line represents the threshold for significance after correcting for multiple testing (P = 0.05/852 = 5.9 × 10⁻⁵). The blue horizontal line represents the threshold for nominal significance (P = 0.05).

