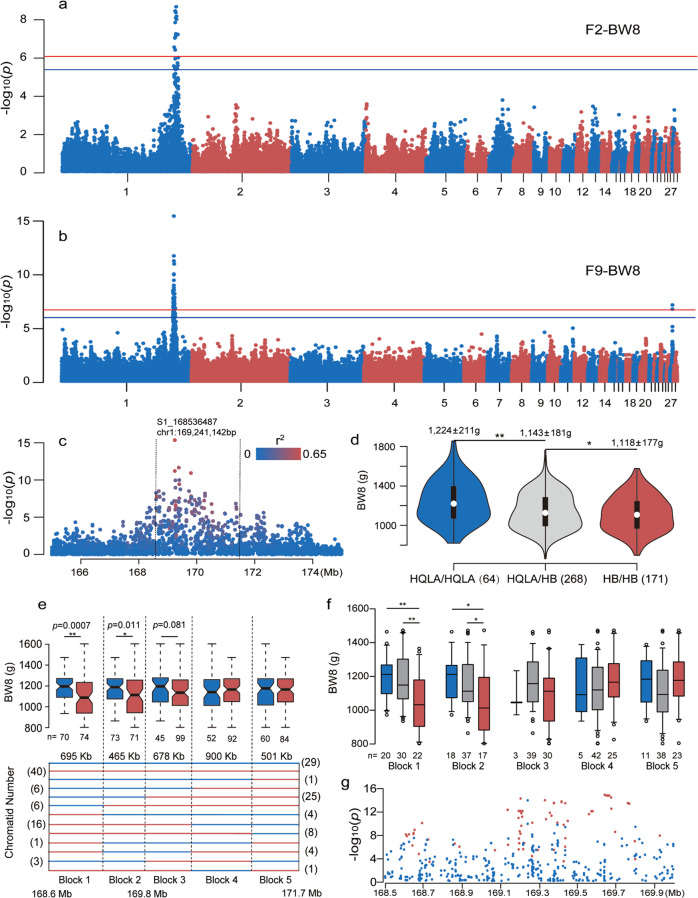
Fig. 1. Fine mapping of a growth and body composition QTL on GGA1.
Manhattan plots for associations to body weight at 8 weeks of age (BW8) in the F2 (a) and F9 (b) generations of the HQLA-HB deep intercross population. The horizontal red/blue lines indicate the genome-wide 1/5% significance thresholds (P values = 8.1 × 10⁻⁷ in F2 and 1.8 × 10⁻⁷ in F9)/(P values = 4.1 × 10⁻⁶ in F2 and 9.2 × 10⁻⁷ in F9), respectively. c Scatter plot illustrating all tested SNPs in the QTL region on GGA1 for BW8 in the F9 generation. The colors of the dots indicate their LD (r2) with the peak SNP (GGA1 at 169,241,142 bp, the highest red dot). d The detailed phenotypic scales (mean ± SD) for the three genotypes (HQLA/HQLA, HQLA/HB, and HB/HB) in the 168.6–171.7 Mb region in 503 individuals carrying unrecombined progenitor chromosomes. **≤0.01 significance level; *≤0.05 significance level. e Seventy-two individuals (144 chromatids) in the F9 generation carry one or two recombinant F0 chromosomes in the peak GGA1 region from 168.6–171.7 Mb. Blue/red lines represent chromosome segments inherited from the HQLA/HB and a block-wise association analysis across this region identified a significant association only to block1 and block2 (168.6–169.8 Mb) to BW8 (P = 0.0007/0.011/0.081/0.326/0.429, respectively). Sample sizes are given below the box plots. Numbers in brackets represent corresponding number of recombinant chromatids. f The detailed phenotypic scales for the three genotypes (HQLA/HQLA, HQLA/HB, and HB/HB) for each block in 72 individuals carrying recombined progenitor chromosomes. g Regional association plots for the significance testing to the 76 additionally genotyped SNPs (red) and GBS-SNPs (blue) across the 1.2 Mb window from 168.6–169.8 Mb.

