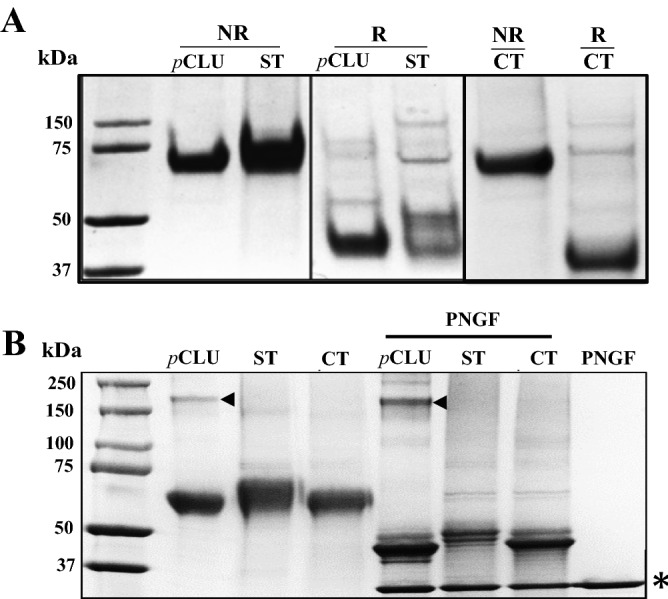
Figure 4.

SDS PAGE analyses of pCLU and rCLU. SDS PAGE analysis of (A) purified pCLU, rCLU-αC-ST (ST) and rCLU-CT (CT) under non-reducing (NR) and reducing conditions (R), and (B) the same samples (non-reduced) treated with or without PNGaseF (PNGF). In (A) and (B), the molecular mass of protein standards (left lane) are shown in kDa. In (B), the position of a low level of contaminating human IgG that co-purifies with pCLU (visible on this gel) is indicated by black arrowheads, and the position of PNGaseF enzyme is indicated by an asterisk at the bottom right of the image. The very minor bands that under reducing conditions migrate to ~ 75 kDa or greater are likely to represent different glycoforms of a small fraction of pCLU/rCLU that is uncleaved when secreted. The results shown are each representative of two independent experiments. In (A), the black bordering rectangles surround images of discrete parts of gels. The complete gel images corresponding to the left and centre panels in (A), and the right panel, are shown in Supplementary Materials Figures S3B and S3C, respectively.
