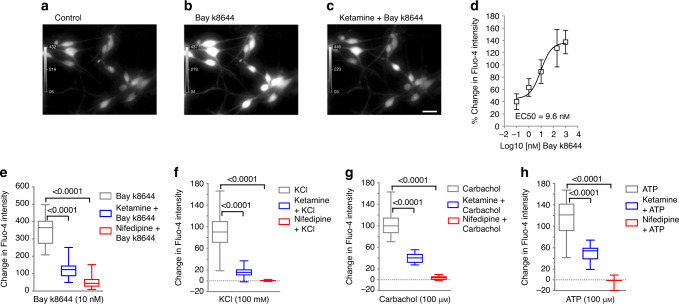
Fig. 5. Ketamine inhibits Cav1.2-mediated calcium influx in mouse BSM cells.
a–c Representative Fluo-4 Ca2+ images of primary cultured mouse BSM cells treated without (a) or with Bay k8644 (10 nM) (b), or treated first with ketamine (100 µg ml−1) and then with added Bay k8644 (10 nM) (c). Scale bar: 40 µm. d Nonlinear curve fit of Bay k8644 concentration-dependent increase in mouse BSM cell [Ca2+]i with EC50 of 9.6 nM (n = 10, 23, 18, 19, 10, and 29 BSM cells for respective [Bay k8644] = 0, 0.1, 1, 10, 200, and 1000 nM). Bars indicate the SD of the means. e 10 nM Bay k8644-induced increase in BSM intracellular [Ca2+] (n = 39 BSM cells) was inhibited by 100 µg ml−1 ketamine (n = 25 BSM cells)) and by 10 µM nifedipine (n = 39 BSM cells). f Hundred millimolar of KCl-stimulated increase in BSM intracellular [Ca2+] (n = 39) was inhibited by 100 µg ml−1 ketamine (n = 25 BSM cells) and by 10 µM nifedipine (n = 39 BSM cells). g Hundred micromolar of carbachol-stimulated increase in BSM intracellular [Ca2+] (n = 27 BSM cells) was inhibited by 100 µg ml−1 ketamine (n = 27 BSM cells), and by 10 µM nifedipine (n = 30 BSM cells). h Hundred micromolar of ATP-stimulated increase in BSM intracellular [Ca2+] (n = 43 BSM cells) was inhibited by 100 µg ml−1 ketamine (n = 22 BSM cells) and by 10 µM nifedipine (n = 21 BSM cells). Data are shown as box and whiskers, center line is the median of the data set, box represents 75% of the data, and bars indicates whiskers from minimum to maximum. Data were analysed by two tailed Student’s t-test. P < 0.05 is considered to be significant and P values are given above the bars. Source data are provided as a Source Data file.

