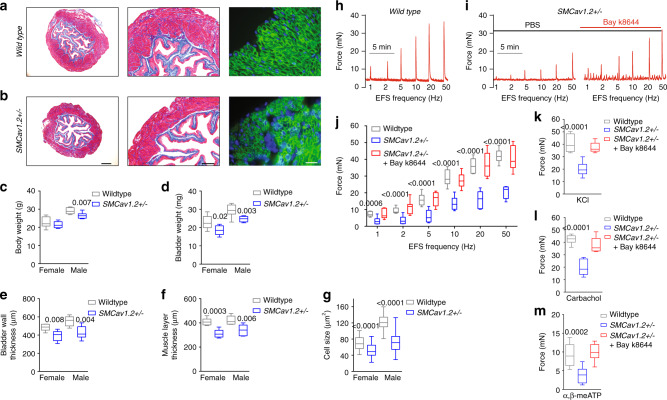
Fig. 8. SMCav1.2+/− mice exhibit abnormal BSM morphology and contractility.
a, b Representative images from three independent experiments: Masson’s trichrome stained bladder sections show that SMCav1.2+/- mouse bladders are smaller with a thinner BSM layer. Scale bars are, from left to right, 400 µm, 200 µm, and 20 µm, respectively. The summarized data are shown in c–f. c, d (n = 8 mice for both wildtype and SMCav1.2+/− groups) show that SMCav1.2+/− mice have lower body weight and bladder weight. e, f (n = 6 mice for both wildtype and SMCav1.2+/− groups) show that SMCav1.2+/− mice have reduced bladder wall and correspondingly lower muscle layer thickness. Individual BSM cells were subjected to immunofluorescence staining and imaged with antiβ1 integrin antibody (green) and DAPI for nuclei (blue). BSM cell cross sectional area was quantitated using Fiji software. SMCav1.2+/− mice BSM cell size was smaller (g n = 32, 54, 55, and 73 cells for wildtype female, SMCav1.2+/− female, wildtype male, and SMCav1.2+/− male mice groups, respectively). h, i Representative BSM contraction force traces in response to EFS show that reduced contraction force measured in SMCav1.2+/− BSM tissue, was enhanced by Bay k8644. j–m summarized data showing SMCav1.2+/− mice BSM strips exhibited decreased contraction force in response to EFS stimulation (j n = 9 BSM strips for both wildtype and SMCav1.2+/− groups), in response to 50 mM KCl (k n = 9 BSM strips for both groups), in response to 10 µM carbachol (l n = 11 BSM strips for both groups), and in response to 10 µM α,β-meATP (m n = 10 BSM strips for both groups). In each condition, contraction was significantly enhanced by 200 nM Bay k8644. Data are shown as box and whiskers, center line is the median of the data set, box represents 75% of the data, and bars indicates whiskers from minimum to maximum. Data are analysed by two tailed Student’s t-test. P < 0.05 is considered to be significant and P values are given above the bars. Source data are provided as a Source Data file.

