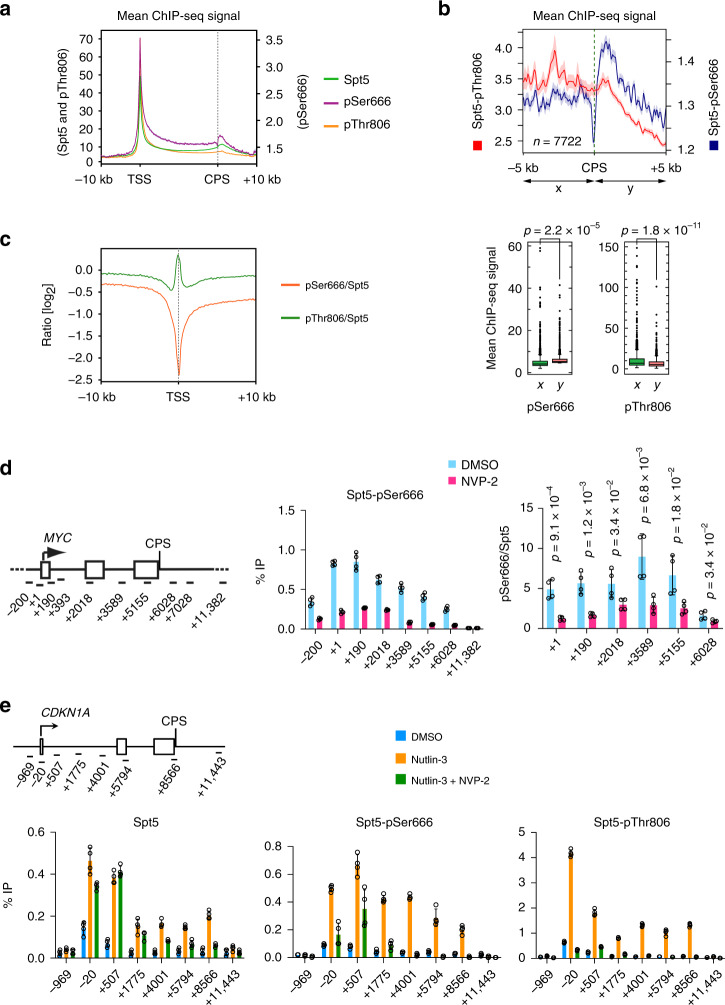
Fig. 4. Chromatin distribution of Spt5-pSer666 is distinct from that of pThr806.
a Metagene analyses (n = 20,130 genes) of ChIP-seq data for total Spt5, Spt5-pThr806, and Spt5-pSer666 (n = 2 biological replicates). b Genes separated from their neighbors at both ends by >10 kilobases (n = 7772) show significant accumulation of pSer666 but not pThr806 downstream of the CPS (top, metagene plots; bottom, box plots). c Metagene analysis of pSer666:Spt5 and pThr806:Spt5 ratios centered over TSS (n = 20,130 genes). d ChIP-qPCR analysis of Spt5-Ser666 phosphorylation on MYC gene in HCT116 cells treated with NVP-2 (250 nM) or mock treated (DMSO) for 1 h. e Schematic of the CDKN1A gene, indicating positions of primer pairs used in ChIP-qPCR analysis (top). ChIP-qPCR analysis of total Spt5, Spt5-pSer666, and Spt5-pThr806 in HCT116 cells mock treated (DMSO) or treated with 5 μM nutlin-3 alone or together with 250 nM NVP-2 for 2 h. Error bars indicate ±s.d. from mean of four independent biological replicates (n = 4) (d and e). Individual data points from biological replicates are shown; indicated p values were calculated using two-sided Student’s t test (b, d, and e). Source data are provided as a Source data file.

