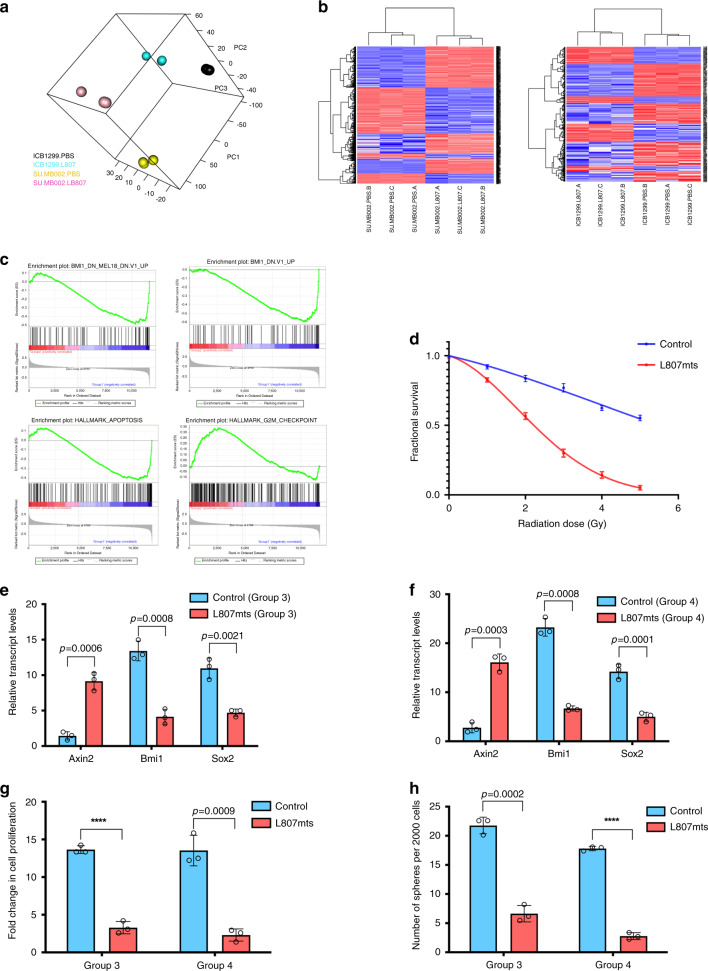
Fig. 4. Pharmacological activation of Wnt signaling in MB impairs stem cell properties.
a Visualization of the first three principal components from PCA of Group 3 and 4 lines treated with small molecule Wnt activator (L807mts) or control (PBS) (n = 3, independent samples per MB line, 1 line per subgroup). b Heatmaps of differentially expressed genes between L807mts- and PBS-treated Group 3 (SU_MB002, left panel) and Group 4 (ICB1299, right panel) MB lines (n = 3, independent samples per MB line, 1 line per subgroup). c GSEA enrichment plots showing that Bmi1 associated genes are significantly reduced while apoptosis and cell cycle inhibitors are enriched in L807mts-treated cells compared with control. d L807mts-treated cells are much more radiosensitive than control cells (1 Gy p = 0.01145; 2 Gy p = 0.0013; 3 Gy p = 0.0004; 4 Gy p = 0.00008; 5 Gy p = 0.00004) (n = 3, independent experiments). Differential Axin2 (Group 3: p = 0.0006, Group 4: p = 0.0003), Bmi1 (Group 3: p = 0.0008, Group 4: p = 0.0008), and Sox2 (Group 3: p = 0.0021, Group 4: p = 0.0001) transcript levels in L807mts-treated (e) Group 3 and (f) Group 4 MB lines (n = 3, independent experiments per MB line, 1 line per subgroup, all samples normalized to GAPDH). Both, g proliferation (Group 3: p = 0.00005, Group 4: p = 0.0009) and h self-renewal (Group 3: p = 0.0002, Group 4: p = 0.000003) are impaired following L807mts treatment in Group 3 and Group 4 MB lines (n = 3, independent experiments per MB line, 1 line per subgroup). Panels (d–h) contain error bars expressed as mean ± standard error (mean) using two-tailed, unpaired Student’s t test. ****p < 0.0001.

